Is it possible to calculate intersection points between two cetz plots?

I was trying different ways to calculate the intersection points from two cetz plots.

#canvas(
      length: 1cm,
      {
        import draw: *
        plot.plot(
          size: (5, 5),
          axis-style: "school-book",
          x-label: [$x$],
          y-label: [$y$],
          {
            intersections(
              "i",
              {
                plot.add(
                  style: (stroke: black + 1.5pt),
                  domain: (-1, 1),
                  x => calc.pow(x, 4) - 2 * calc.pow(x, 2) + 1,
                )
                plot.add(
                  style: (stroke: black + 1.5pt),
                  domain: (-1, 1),
                  x => -(calc.pow(x, 4) - 2 * calc.pow(x, 2) + 1),
                )
              },
            )
          },
        )
      },
    )

Is this even possible, or should i calculate the intersection points outside of typst/cetz?
When you mean calculate them, do you want to reference them (like point to them) or do you want the values?

If you need to have a reference, you could do something like my example:

#import "@preview/cetz:0.3.1": canvas, draw
#import "@preview/cetz-plot:0.1.0": plot


#let intersection(plotA, plotB, style: (stroke: red + 2pt)) = {
  let dataA = plotA.first().data
  let dataB = plotB.first().data

  let points = dataA.filter(x => x in dataB)

  for ((i, point)) in points.enumerate() {
    plot.add-anchor("i_" + str(i),point )
  }

  plotA
  plotB
}

#canvas(
  length: 1cm,
  {
    import draw: *
    plot.plot(
      name: "my_plot",
      size: (5, 5),
      axis-style: "school-book",
      x-label: [$x$],
      y-label: [$y$],
      {
      intersection(
        plot.add(
          style: (stroke: black + 1.5pt),
          domain: (-1, 1),
          x => calc.pow(x, 4) - 2 * calc.pow(x, 2) + 1,
        ),
        plot.add(
          style: (stroke: black + 1.5pt),
          domain: (-1, 1),
          x => -(calc.pow(x, 4) - 2 * calc.pow(x, 2) + 1),
        )
      )
      }
    )

    // reference the point with {plot name}.i_{number}
    line("my_plot.i_1", ((), "|-", (0,3.5)), mark: (start: ">"), name: "line")
    content("line.end", [Here], anchor: "south", padding: .1)
  },
)

The function just takes the plots, and access its values, before passing it on. This can be modified to for example output the values and so on.
(note: intersections might not be shown 100% of the time, since the calculation is discrete.)

1 Like

Thank’s for your quick solution!

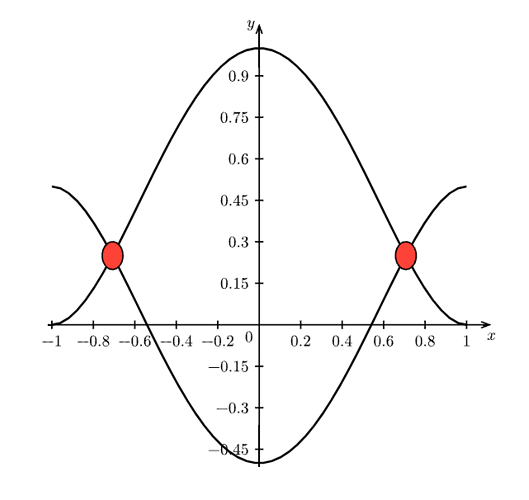
I’ve used your code to create a similar, but different approach, to solve this problem. Now the only remaining issue is the scaling of the drawn objects in the plot.annotate function.

#let intersection(plotA, plotB, style: (stroke: red + 2pt)) = {
  import draw: *
  let dataA = plotA.first().data
  let dataB = plotB.first().data

  plot.annotate({
    hide({
      intersections("i", line(..plotA.first().data), line(..plotB.first().data))
    })
    for-each-anchor("i", (name) => {
      circle("i." + name, radius: 0.05, fill: red)
    })
  })

  plotA
  plotB
}

#canvas(
  length: 1cm,
  {
    import draw: *
    plot.plot(
      name: "plot",
      size: (10, 10),
      axis-style: "school-book",
      x-label: [$x$],
      y-label: [$y$],
      {
        intersection(
          plot.add(
            style: (stroke: black + 1.5pt),
            domain: (-1, 1),
            x => calc.pow(x, 4) - 2 * calc.pow(x, 2) + 1,
          ),
          plot.add(
            style: (stroke: black + 1.5pt),
            domain: (-1, 1),
            x => -(calc.pow(x, 4) - 2 * calc.pow(x, 2) + 0.5),
          ),
        )
      },
    )
  },
)

Is there any option to make the circle perfectly round, without manually calculating the scale base of the axis scaling?