Hello,
my current solution is this:
#let words = (
"first",
"second",
"third",
"fourth",
"fifth",
"sixth",
"seventh",
"eighth",
"ninth",
"tenth",
"eleventh",
"tvelveth"
);
#let len = words.len()
#let dia = lq.diagram(
width: 10cm, height: 10cm,
lq.colormesh(
lq.linspace(0, len - 1, num: len),
lq.linspace(0, len - 1, num: len),
(x, y) => x * y, // for illustration purposes, for real data use the array
// data
// .at(calc.floor(y))
// .at(calc.floor(x)),
map: color.map.viridis
),
xaxis: (
ticks: words.map(rotate.with(-90deg, reflow: true)).enumerate(),
subticks: none,
position: top,
),
yaxis: (
ticks: words.enumerate(),
subticks: none,
inverted: true,
),
)
#let legend = lq.diagram(
width: 0.25cm,
height: 10cm,
lq.colormesh(
interpolation: "smooth",
lq.linspace(0, 1),
lq.linspace(0, 1),
(x, y) => y
),
xaxis: none,
yaxis: (
position: right,
subticks: none,
tick-distance: 0.2,
)
)
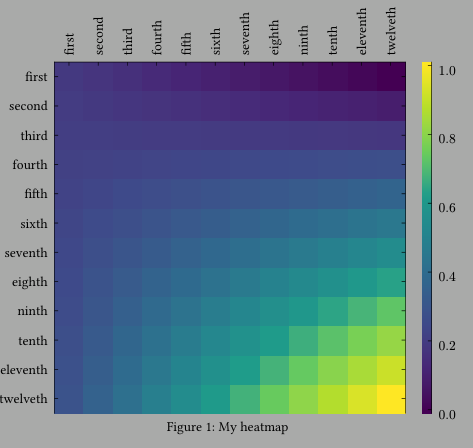
#figure(
grid(
align: bottom,
gutter: 0.5cm,
columns: 2,
dia,
legend,
),
scope: "parent",
placement: auto,
caption: [My heatmap]
) <heat-map>
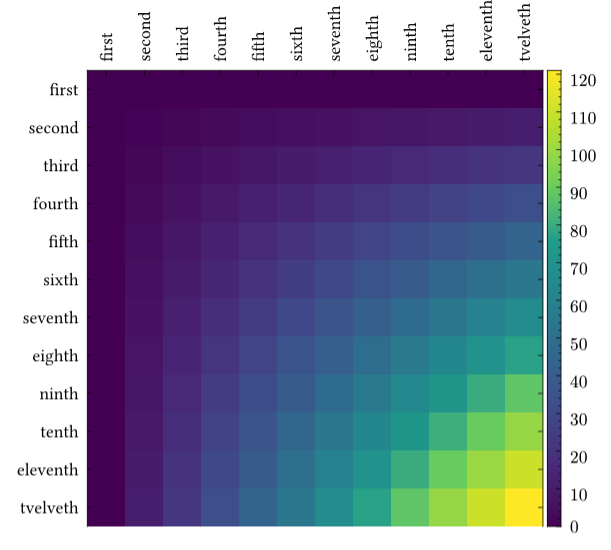
And the result looks something like this:
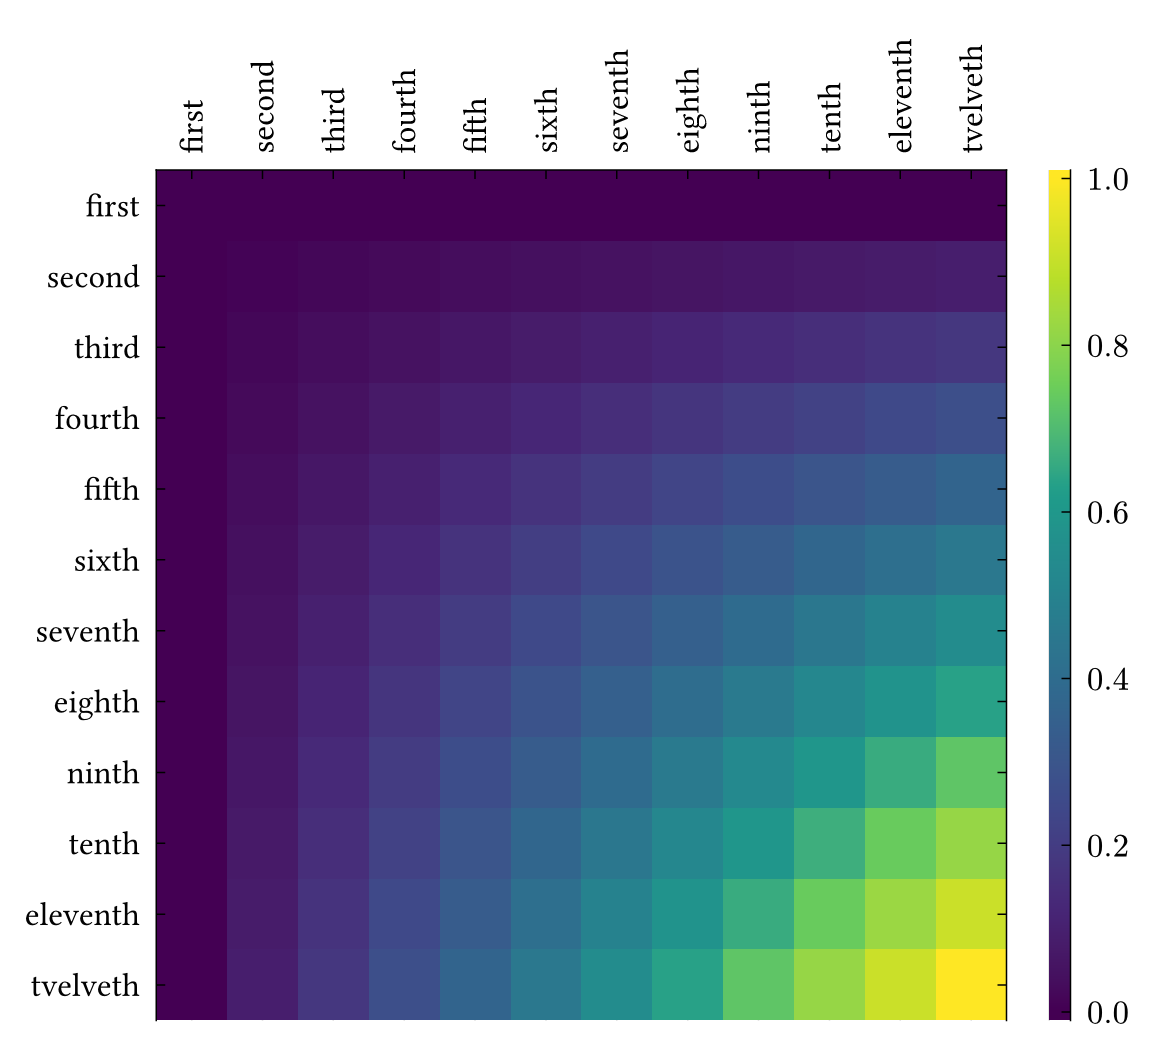
Still, something tells me this can be implemented easier and cleaner. Any suggestions?