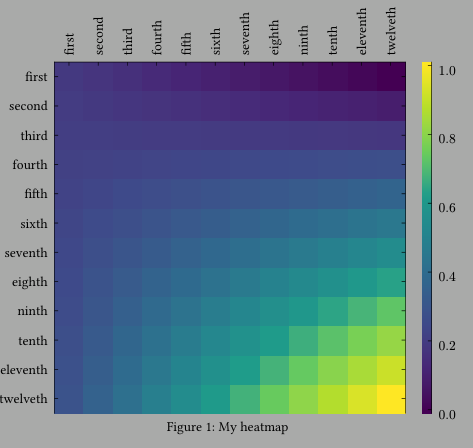
My suggestion is to request the addition of a continuous legend for the heatmap diagram.
#import "@preview/lilaq:0.3.0" as lq

/// Style for heatmap diagram.
#let heatmap-style(doc) = {
  set rotate(reflow: true)
  show: lq.set-diagram(
    xaxis: (subticks: none, position: top),
    yaxis: (subticks: none, inverted: true),
    width: 10cm,
    height: 10cm,
  )
  doc
}

/// Continuous legend style for heatmap diagram.
#let heatmap-legend-style(doc) = {
  show: lq.set-diagram(
    yaxis: (position: right, subticks: none, tick-distance: 0.2),
    xaxis: none,
    width: 0.25cm,
    height: 10cm,
  )
  doc
}

#let heatmap-with-legend(diagram, range) = grid(
  columns: 2,
  align: bottom,
  gutter: 0.5cm,
  heatmap-style(diagram),
  heatmap-legend-style(lq.diagram(lq.colormesh(
    interpolation: "smooth",
    range,
    range,
    (_, y) => y,
  ))),
)

#let words = (
  "first",
  "second",
  "third",
  "fourth",
  "fifth",
  "sixth",
  "seventh",
  "eighth",
  "ninth",
  "tenth",
  "eleventh",
  "twelveth",
)

#let length = words.len()
#let x = lq.linspace(2, 20, num: length)
#let y = lq.linspace(-4, 15, num: length)

#figure(
  heatmap-with-legend(
    lq.diagram(
      xaxis: (ticks: x.zip(words.map(rotate.with(-90deg)))),
      yaxis: (ticks: y.zip(words)),
      lq.colormesh(x, y, (x, y) => x * y, map: color.map.viridis),
    ),
    lq.linspace(0, 1),
  ),
  caption: [My heatmap],
) <heat-map>