The version 0.2.0 just dropped ![]() :)
:)
You can find the documentation at https://lilaq.org/.
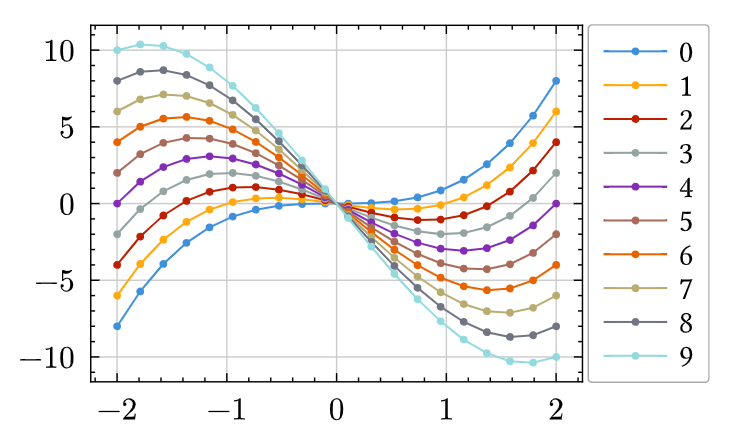
With this release, important improvements are made to the defaults, prominently including a new default color cycle.
Feedback on the default settings are welcome! Defaults are important because they are often left unchanged by the user − currently, Lilaq is in a stage where defaults can still be tuned. Later, such breaking changes will be mostly impossible.
You can open a Discussion on GitHub and share your thoughts there.
Instead of a somewhat arbitrary color cycle, Lilaq now uses a thoroughly researched, highly optimized color sequence that is friendly to people with color deficiencies. This map is a result of the work of M. A. Petroff ([2107.02270] Accessible Color Sequences for Data Visualization).
On top, Lilaq ships a small set of color sequences, available under lq.color.map.
Moreover, the default axis thickness and tick length have been reduced, resulting in a better harmony with text surrounding a diagram figure.
The mark shapes of Lilaq are carefully designed to match in optical size, so they look good together in one plot without further adaptation. This release makes some fine adjustments to the mark sizes. Furthermore, some marks have been added and a few ones renamed (see below).
The most important fixes in this release concern a bug that made it impossible to replace the default style cycle and an issue when first-line-indent was applied to all paragraphs.
Changelog
Highlights
- Lilaq now features a professional default color cycle.
Added
plot.everyfor plotting marks for only a subset of the data points.- Sequential color maps, e.g., for style cycles under
lq.color.map. - Tools for creating cycles.
- Options
tipandtoetolq.pathfor adding arrow tips or other marks.
Improved
diagram.xaxisanddiagram.yaxisdictionaries will now fold which is useful forsetrules and overriding only specific settings made in templates.axis.dxandaxis.dycan now be of typerelativeorratiofor more positioning control.- Ticks now use
cap: "butt"by default leading to better results when the spine stroke is set tonone. This also shortens the ticks by half their width compared to before. - The function
locate-ticks-linearnow features a parameterdensitythat can be used to tune the number of generated ticks based on the automatic estimate. - The parameter
label.padcan now benonefor placement directly on the axis (ignoring the ticks). diagram.cyclecan now also take an array of colors for the common case that the style cycle only consists of color changes. Moreover, and array of dictionaries with the possible keyscolor,stroke, andmarkis supported.
Marks
- Tweaked mark sizes.
 Replaced
 trianglewith^and added other triangle rotations<,>, andv.- Replaced
diamondwithd - Replaced
pentagon,hexagon,heptagon, andoctagonwithp5,p6,p7,p8. - Added star variations
s3,s4,s5, ands6 - Default mark stroke thickness is now 0.7pt instead of 1pt matching it with the default line width of 0.7pt.
Other breaking changes
- The default color cycle has changed. We now use a color sequence introduced by Matthew A. Petroff in https://arxiv.org/pdf/2107.02270 that is optimized for distinguishability, aesthetics, and people with color deficiencies.
- The default spine thickness has changed from
0.7ptto0.5pt. - The default tick length has been reduced from
4ptto3pt. -
diagram.legendno longer supportsboolarguments. Instead, uselegend: noneto turn the legend off (orlegend: (:)to turn it back on after it has been deactivated previously). - The default color of
vlinesandhlinesis now black instead of blue.
Fixed
- An urgent bug with style cycle lists being appended.
- The bottom axis being misplaced when a first-line-indent is applied to all paragraphs.
- Combination of
plot.stroke: noneand a fixedplot.colorresulted in black error bars.
Documentation
- Added examples for advanced bar charts with labels and error bars.
- Added mark documentation and tutorial.
- Improved style cycle documentation.