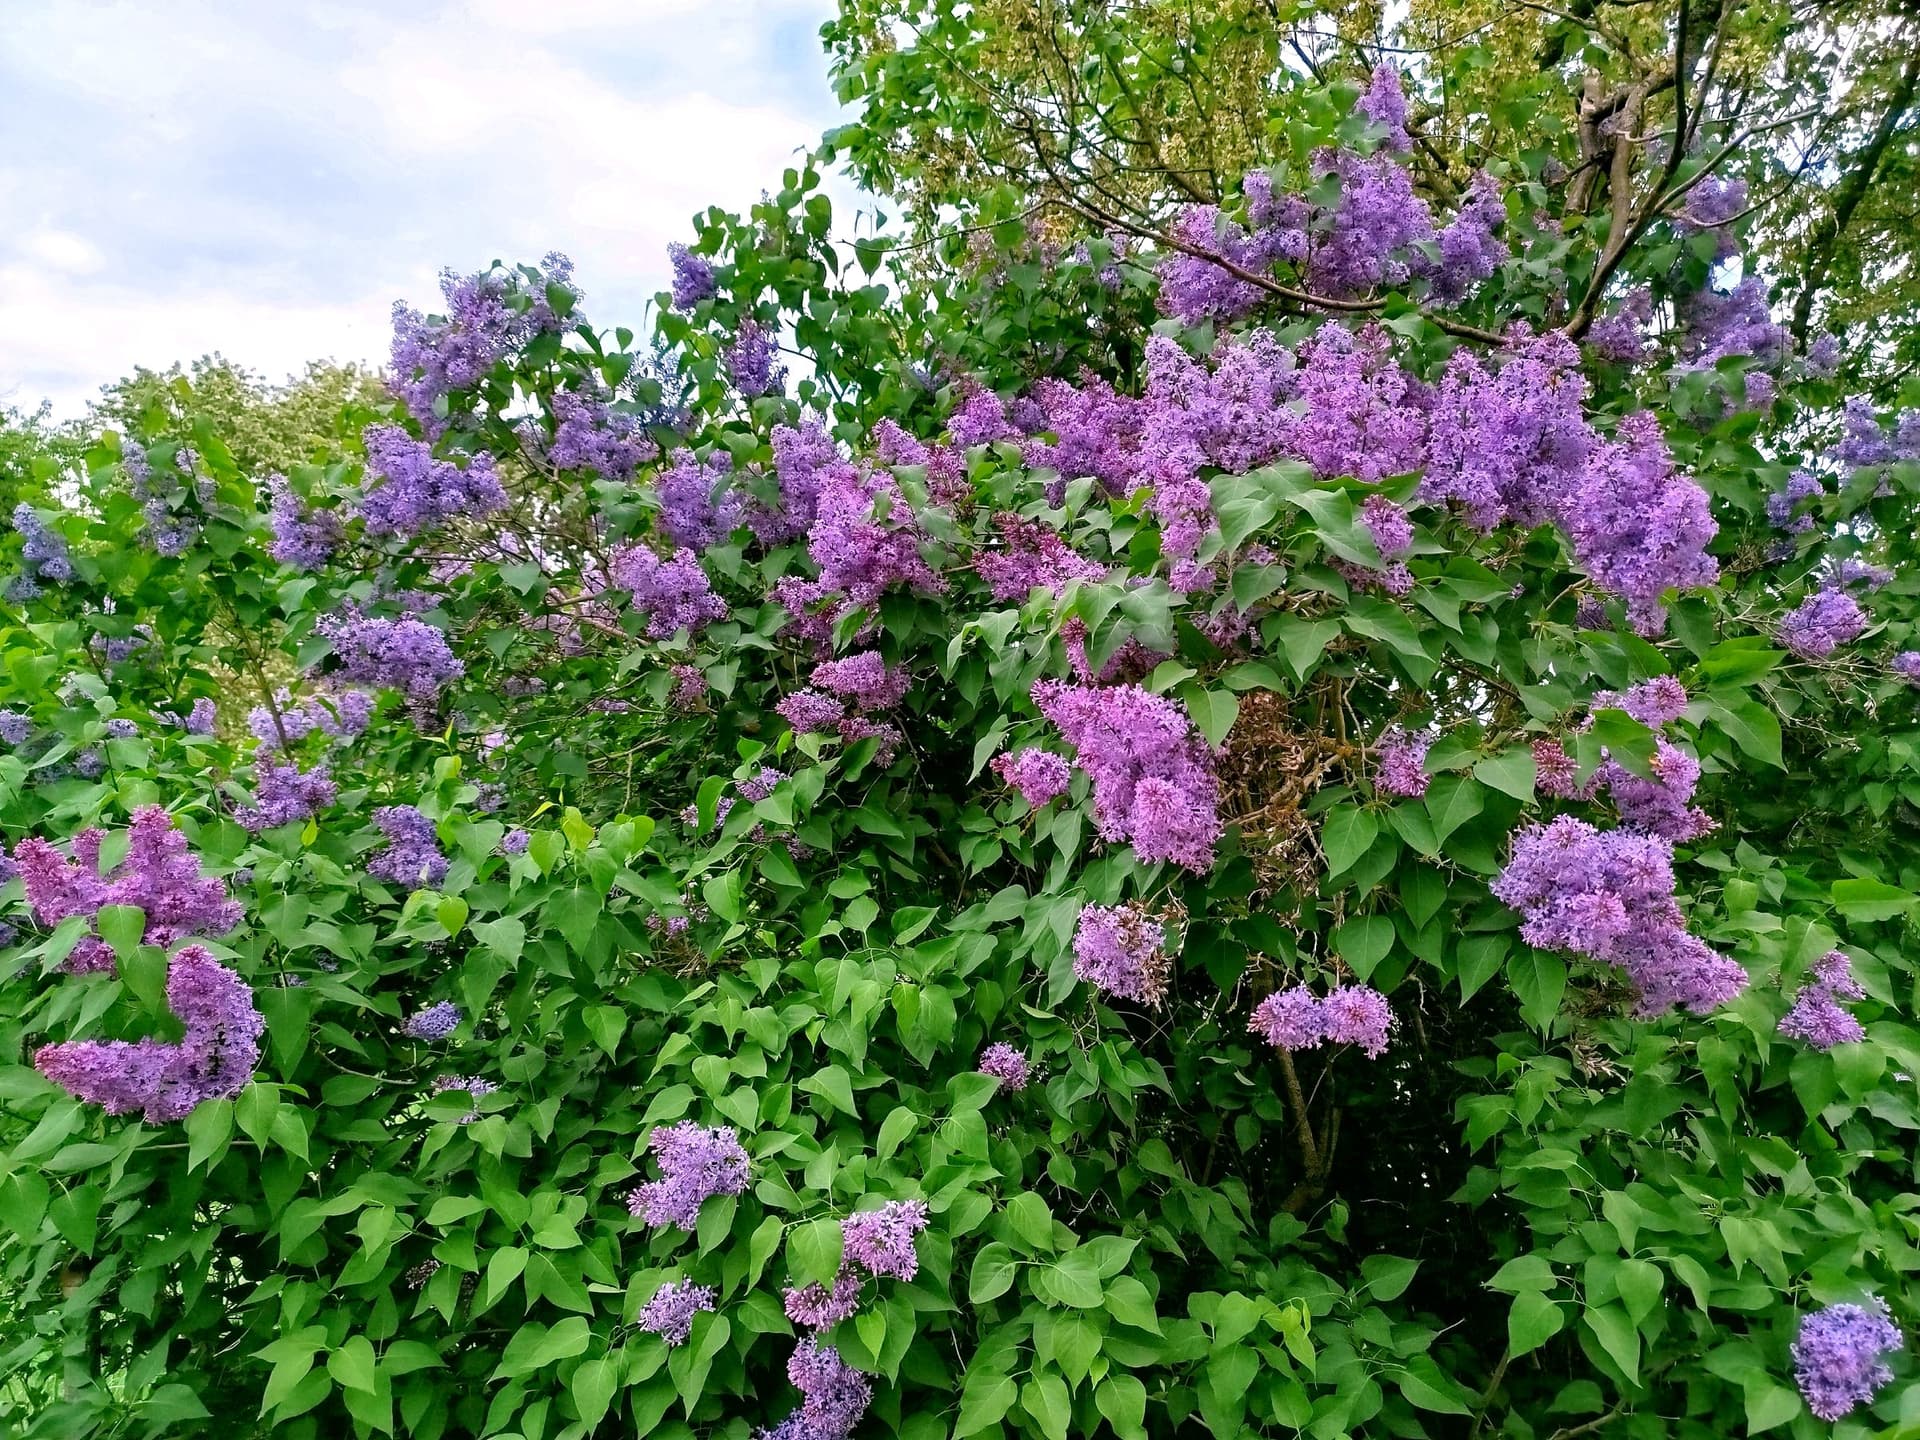
The lilac is blooming! What a beautiful time to add two colorful new corners to the Lilaq package.
Lilaq is a framework for scientific data visualization. The new version ships with a set of predefined Themes that you can use to quickly change the style of your plots. It’s also easy to design your own themes.
The Color reference now shows all available color maps. There are many new ones and they are all colorblind-friendly and scientific (that is, perceptually uniform and ordered).
Moreover, various improvements to important components of Lilaq have been made. Notably, we have added a new tutorial on data loading with Typst and Lilaq.
The full changelog can be found at Release: Lilaq 0.3.0 − Lilaq.
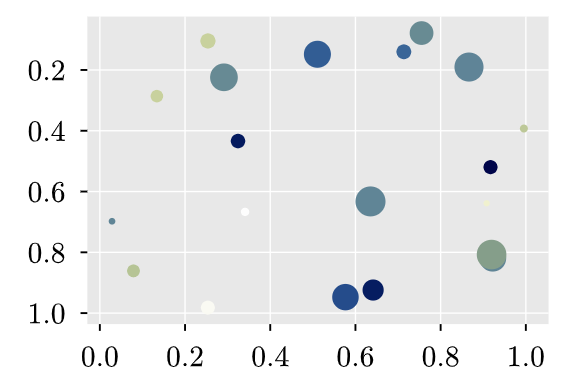
The example below showcases some of the new features.
#show: lq.theme.misty

#let (x, y, size, color) = json("data.json")

#lq.diagram(
  yaxis: (inverted: true),

  lq.scatter(
    x, y,
    size: size,
    color: color,
    map: lq.color.map.davos
  )
)