Lilaq is a powerful and easy-to-use plotting library for Typst.
With version 0.4.0, we finally get
and a lot more.
You can read the full changelog at Release: Lilaq 0.4.0 − Lilaq. On the web page, you can also find an extensive documentation for Lilaq.
If you would like to support development, you can give the repository a ![]() or sponsor the project on GitHub. Contributions are also welcome, please check out the Contributing Guide.
or sponsor the project on GitHub. Contributions are also welcome, please check out the Contributing Guide.
This release greatly benefits from updating the dependency elembic introducing features like conditional set rules likeshow: lq.cond-set(lq.grid.with(kind: "x"), stroke: yellow) and filtered show rules through lq.show_(lq.tick-label.with(sub: true), it => {..}).
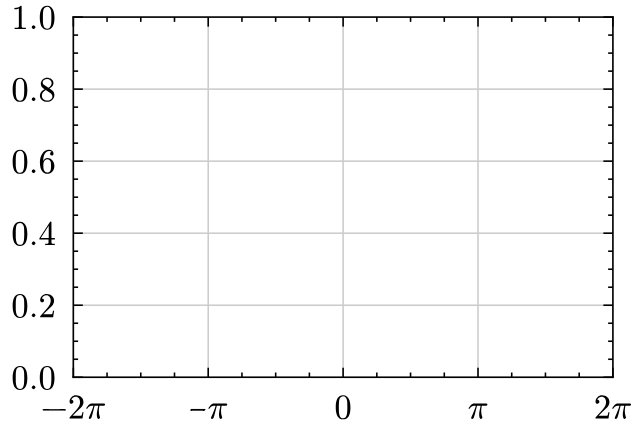
Moreover, plenty of work on ticks has been done! It is now super easy to setup π-based axes (or any other constant), to give labels to subticks, manually add extra ticks and a lot more.


