This new version of Lilaq is out now! It introduces several major features including:
- native datetime support for time series plotting,
- relative sizing for diagrams,
- passing functions as
yarguments, - and significant performance improvements through integration with the new package Komet.
The full changelog can be found at Release: Lilaq 0.5.0 − Lilaq.
If you would like to support development of this open-source project, you can give the repository a ![]() or sponsor the project on GitHub. Contributions are also welcome, please check out the contributing guide!
or sponsor the project on GitHub. Contributions are also welcome, please check out the contributing guide!
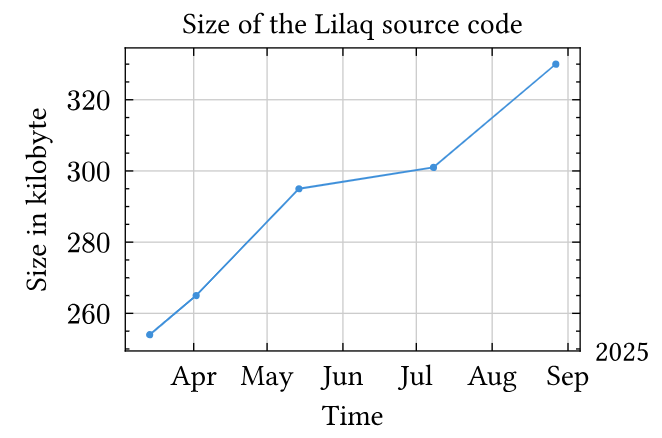
Support for datetime values in plots
Most plot types now accept arrays of datetime values. In this case, the axis scale lq.scale.datetime is automatically activated, providing suitable tick locations and labels. This new feature is explained in the time series tutorial.
#import "@preview/lilaq:0.5.0" as lq
#let dates = (
  datetime(year: 2025, month: 3, day: 14),
  datetime(year: 2025, month: 4, day: 2),
  datetime(year: 2025, month: 5, day: 14),
  datetime(year: 2025, month: 7, day: 8),
  datetime(year: 2025, month: 8, day: 27),
)

#lq.diagram(
  title: [Size of the Lilaq source code],
  ylabel: [Size in kilobyte],
  xlabel: [Time],
  lq.plot(dates, (254, 265, 295, 301, 330))
)
Functions as y arguments
The y argument for most plotting functions now also accepts a function instead of an array which is useful when the y-values are computed from the x-values through a function. This way you can write
#lq.diagram(
  lq.plot(lq.linspace(0, 10), x => x*x)
)
instead of
#let xs = lq.linspace(0, 10)

#lq.diagram(
  lq.plot(xs, xs.map(x => x*x))
)
In the first case, the function is evaluated automatically for each x-coordinate.
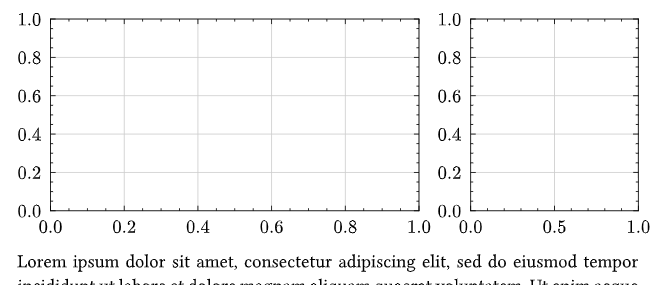
Sizing with ratios and relative lengths.
Finally, Lilaq diagrams can take widths or heights such as 100% which is useful for filling the available space and creating more complex one-dimensional layouts.
#grid(
  columns: (2fr, 1fr),
  column-gutter: 1em,
  lq.diagram(
    width: 100%
  ),
  lq.diagram(
    width: 100%
  )
)