Today, Lilaq is one year old ![]()
![]() .
.
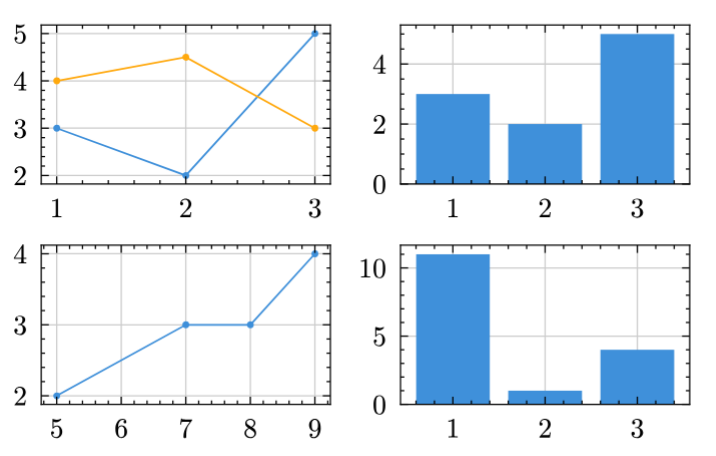
Exciting news! Lilaq 0.6.0 introduces ultra-flexible support for plot grids, also known as group or subplots.
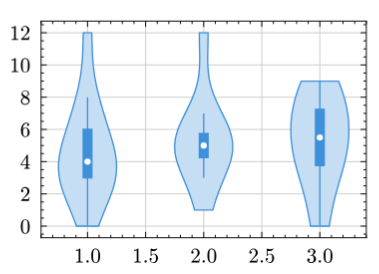
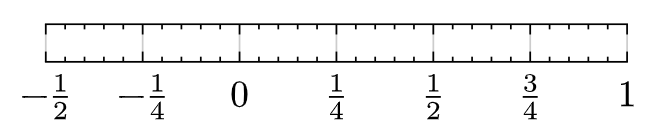
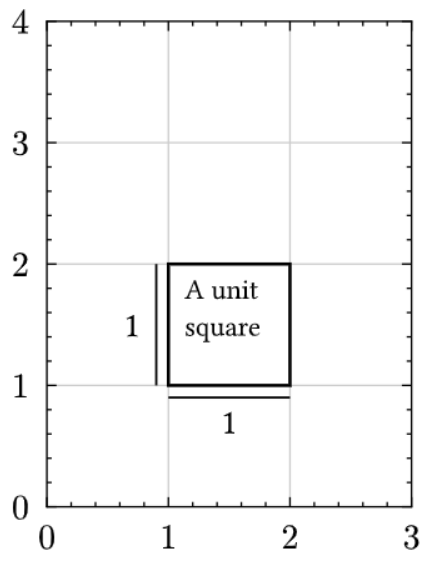
On the front of plotting functions, we added the new twins violin and hviolin and a new tick formatter for displaying fractions. Moreover, we significantly improved date/time support and introduced functionality for fixing the aspect ratio between x and y data coordinates.
Apart from these highlights, we made numerous improvements and fixes. In fact, this is the biggest release since version 0.1.0! The full changelog can be found at https://lilaq.org/blog/release-0.6.0.
This open-source project is entirely developed in my free time − out of a vision for data visualization that is easily accessible: both for the creators and the consumers. If you would like to support development of this project, you can give the repository a ![]() or sponsor the project by a small amount. This helps me allocate time for working on features/docs and maintaining this project long-term. Contributions are also welcome, please check out the contributing guide!
or sponsor the project by a small amount. This helps me allocate time for working on features/docs and maintaining this project long-term. Contributions are also welcome, please check out the contributing guide!
I want to express my gratitude to all users, bug-reporters, contributors, and sponsors! ![]()
Below, some of the new features of Lilaq are showcased.
Plot grids / Subplots
Finally, grids of subplots are possible with Lilaq: Just use the Typst function grid and apply the magic show rule show: lq.layout to align the axes of all diagrams. This show rule integrates seamlessly with all features provided by the grid function, including
- rowspans and colspans,
- row and column gutters,
- filling the available cell space with diagrams that have
100%width and/or height, - and distributing space proportionally, e.g., by specifying fractional column sizes like
columns: (1fr, 2fr).
You can find more information and tricks on plot grids in the plot grid tutorial.
#show: lq.set-diagram(width: 4cm, height: 2.2cm)

#figure({
  show: lq.layout // special layout rule

  grid(
    columns: 2,
    row-gutter: 1em,
    column-gutter: 1em,
    lq.diagram(..),
    lq.diagram(..),
    lq.diagram(..),
    lq.diagram(..),
  )
})
Other highlights
- Violin plots.
- Automatic and configurable fractional tick formatter.
- Fixed aspect ratio between x and y coordinates, either by automatic width/height or by adjusting the margins within the diagram.
lq.colormeshnow accepts a) pre-rendered images and b) edge instead of center coordinates as an alternative.lq.plotnow has parametersplot.tipandplot.toefor adding arrow marks.- Datetime support has been massively improved and extended to the primitive functions like
lq.placeandlq.line. - The width of bar plots is now by default adaptive, preventing invisibly thin or far too wide bars when the coordinate spacing is not near to 1. See
bar.width. - Diagram bounds are now by default strict, meaning that all tick labels are entirely included. Before, outer labels were allowed to hang into the margins to make alignment between diagrams easier but since this problem is now properly solved with plot grids, the diagram bounds can always be tight. See
diagrams.bounds.
See you around!