Today is official π-day and also Einstein’s Birthday! What a perfect occasion to release a scientific data plotting framework. (And no, it wasn’t planned this way!)
Many of you have heard of this project through the talk at the recent Typst meetup. Now, we are excited to announce that the package is finally available.
Lilaq is a data visualization package for Typst, combining the:
-
Ease of use and fast learning curve of Matplotlib, making it accessible for beginners.
-
Possibilities of document integration and uniform styling of PGFplots, ensuring professional and consistent visual output.
It is easy to learn, features powerful configuration and preset creation through mock-up custom elements, and benefits from the real-time preview of Typst. Due to its use of the package Zero, consistent number formatting with the rest of the document can be guaranteed.
If you like Lilaq, you can support this immense endeavor with:
-
 a star for the repository, or
Lilaq has a website! The entire documentation, filled with tutorials, examples, and detailed technical references, lives at:
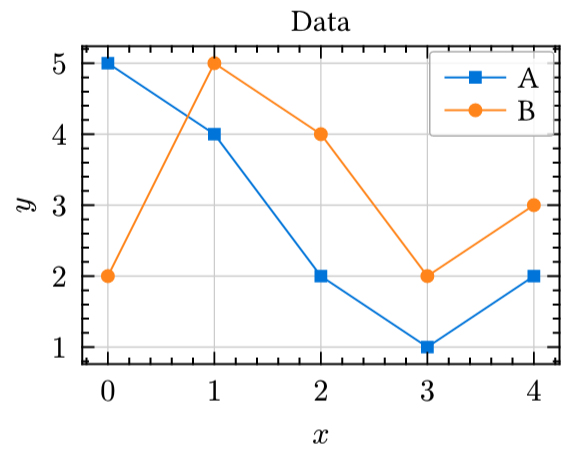
Below you can find a simple usage example.
#import "@preview/lilaq:0.1.0" as lq

#let xs = (0, 1, 2, 3, 4)

#lq.diagram(
  title: [Data],
  xlabel: $x$,
  ylabel: $y$,

  lq.plot(xs, (5, 4, 2, 1, 2), mark: "s", label: [A]),
  lq.plot(xs, (2, 5, 4, 2, 3), mark: "o", label: [B])
)

