Hello,
Quick question about using the contour plot for the lilaq package. Is it possible to number the contour lines like it is in maps?
If no, is there a good-enough workaround?
#align(center, {
  let x = lq.linspace(-1.5,2.0)
  let y = lq.linspace(-0.5,3.0)
  lq.diagram(
    lq.contour(
      x,y,
      (x, y) => (calc.pow((1 - x), 2) + 100 * calc.pow(y - calc.pow(x,2), 2)),
      map: lq.color.map.plasma,
      max: 300,
      min: 10,
      levels: (800,600, 400, 200,100, 50, 10)
    )
  )
})
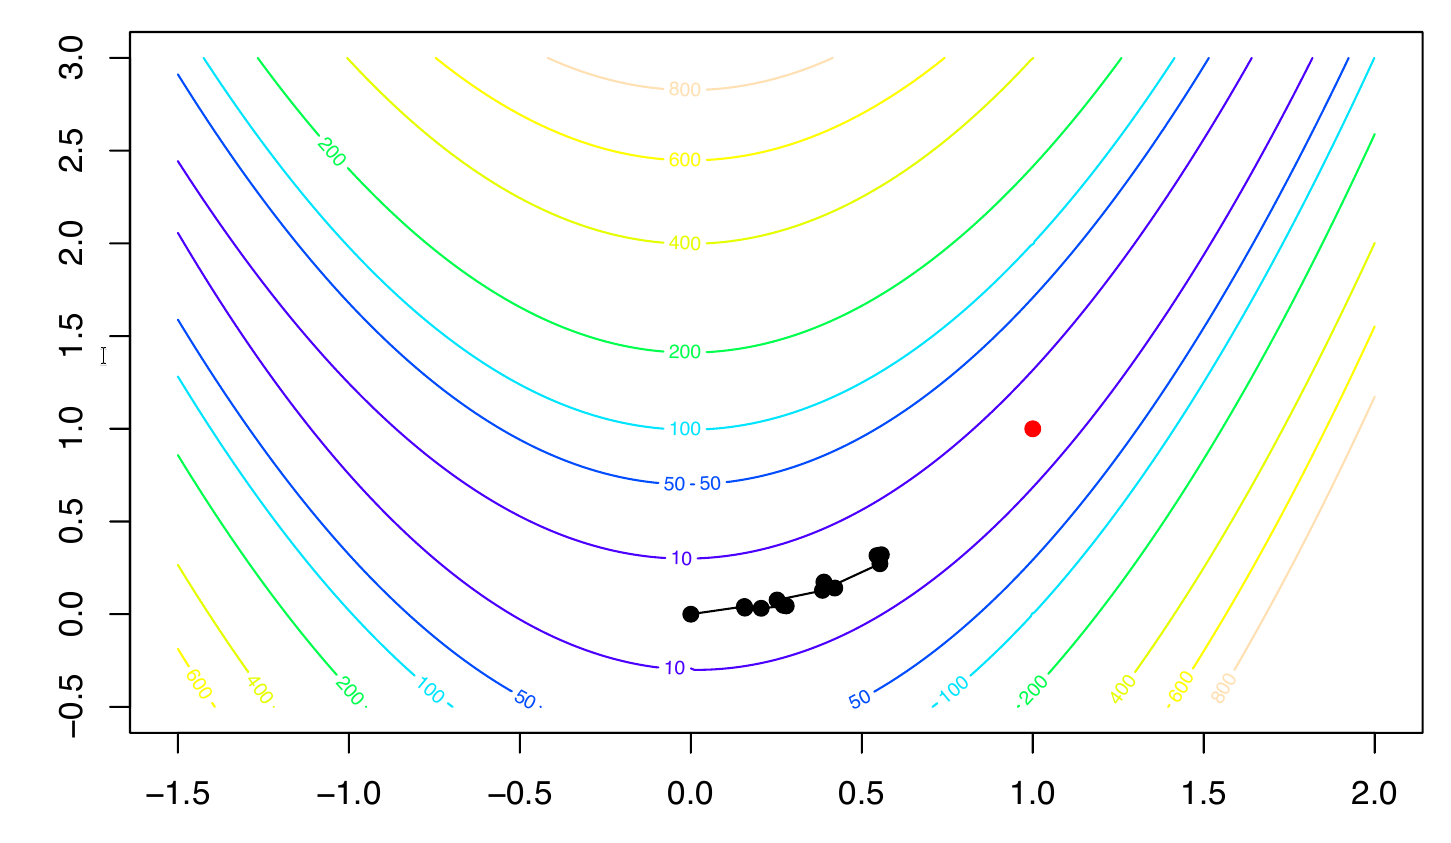
As reference what I’m trying to achieve (just the contour numbers, not the axis spacing nor the plotted line and red dot):