-
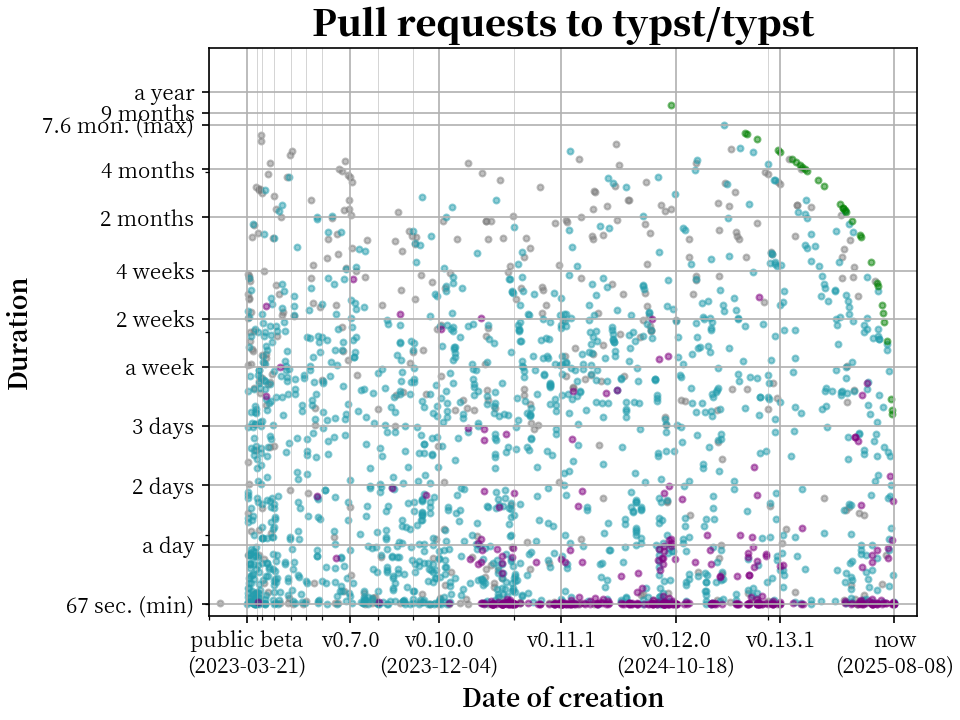
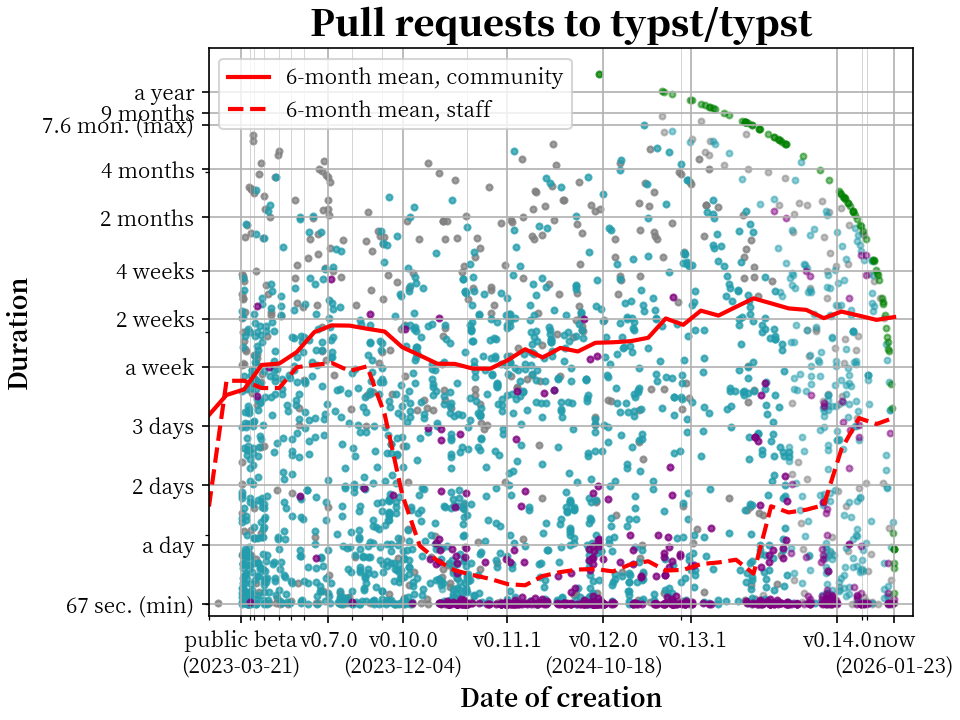
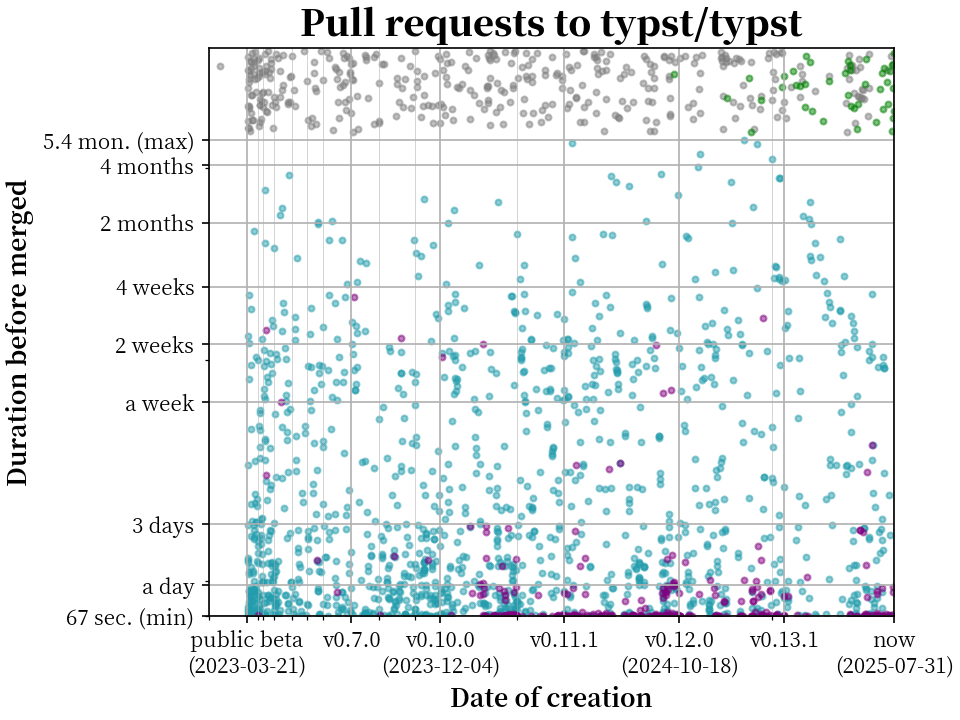
Merged pull requests
- by laurmaedje or reknih — Purple dots
- by other human contributors — Blue dots
- by dependabot — not drawn
-
Closed pull requests — Gray dots
-
Open pull requests — Green dots
For unmerged (closed/open) PRs, durations cannot be defined, and their y coordinates in the figure are random.
Python scripts
fetch_data.py
Requires GitHub CLI.
from pathlib import Path
from pprint import pprint
from subprocess import run
import json

file = Path("data.jsonl")

query = """
query($cursor: String) {
  repository(owner: "typst", name: "typst") {
    pullRequests(first: 100, after: $cursor, orderBy: {field: CREATED_AT, direction: ASC}) {
      pageInfo {
        hasNextPage
        endCursor
      }
      nodes {
        number
        title
        state
        createdAt
        mergedAt
        author {
          login
        }
      }
    }
  }
}
""".strip()


page: dict | None = None
while page is None or page["hasNextPage"]:
    result = run(
        ["gh", "api", "graphql", "--raw-field", f"query={query}"]
        + (["--field", f"cursor={page['endCursor']}"] if page else []),
        text=True,
        check=True,
        capture_output=True,
    )
    data = json.loads(result.stdout)["data"]["repository"]["pullRequests"]
    page = data["pageInfo"]
    pulls = data["nodes"]

    pprint(page)

    for p in pulls:
        pprint(p)
        with file.open("a", encoding="utf-8") as f:
            f.write(json.dumps(p) + "\n")
plot_data.py
# /// script
# requires-python = ">=3.12"
# dependencies = [
#     "matplotlib",
# ]
# ///
import json
import random
from collections import deque
from dataclasses import dataclass
from datetime import datetime, timedelta
from pathlib import Path

from matplotlib.pyplot import subplots

random.seed(42)

file = Path("data.jsonl")


@dataclass
class Record:
    createdAt: datetime
    duration: timedelta


merged_pulls: deque[Record] = deque()
staff_pulls: deque[Record] = deque()
closed_pulls: deque[datetime] = deque()
open_pulls: deque[datetime] = deque()

staff = ["laurmaedje", "reknih"]
bot = ["dependabot"]

with file.open(encoding="utf-8") as f:
    while line := f.readline():
        row = json.loads(line)
        createdAt = datetime.fromisoformat(row["createdAt"])

        author: dict | None = row["author"]
        if author is not None and author["login"] in bot:
            # `author` might be `None`
            # See https://github.com/ghost and https://github.com/typst/typst/pull/1047
            continue

        match row["state"]:
            case "MERGED":
                mergedAt = datetime.fromisoformat(row["mergedAt"])
                duration = mergedAt - createdAt
                record = Record(createdAt=createdAt, duration=duration)

                if author is not None and author["login"] in staff:
                    staff_pulls.append(record)
                else:
                    merged_pulls.append(record)
            case "CLOSED":
                # This PR is not merged (closed or still open)
                closed_pulls.append(createdAt)
            case "OPEN":
                open_pulls.append(createdAt)


xticks = [
    # https://typst.app/blog/2023/january-update
    (datetime(2023, 1, 29), None),
    # https://typst.app/blog/2023/beta-oss-launch
    (datetime(2023, 3, 21), "public beta\n(2023-03-21)"),
    # https://typst.app/docs/changelog/0.1.0/
    (datetime(2023, 4, 4), None),
    # https://typst.app/docs/changelog/0.2.0/
    (datetime(2023, 4, 11), None),
    # https://typst.app/docs/changelog/0.3.0/
    (datetime(2023, 4, 26), None),
    # https://typst.app/docs/changelog/0.4.0/
    (datetime(2023, 5, 20), None),
    # https://typst.app/docs/changelog/0.5.0/
    (datetime(2023, 6, 9), None),
    # https://typst.app/docs/changelog/0.6.0/
    (datetime(2023, 6, 30), None),
    # https://typst.app/docs/changelog/0.7.0/
    (datetime(2023, 8, 7), "v0.7.0"),
    # https://typst.app/docs/changelog/0.8.0/
    (datetime(2023, 9, 13), None),
    # https://typst.app/docs/changelog/0.9.0/
    (datetime(2023, 10, 31), None),
    # https://typst.app/docs/changelog/0.10.0/
    (datetime(2023, 12, 4), "v0.10.0\n(2023-12-04)"),
    # https://typst.app/docs/changelog/0.11.0/
    (datetime(2024, 3, 15), None),
    # https://typst.app/docs/changelog/0.11.1/
    (datetime(2024, 5, 17), "v0.11.1"),
    # https://typst.app/blog/2024/typst-0.12
    (datetime(2024, 10, 18), "v0.12.0\n(2024-10-18)"),
    # https://typst.app/blog/2025/typst-0.13
    (datetime(2025, 2, 19), None),
    # https://typst.app/docs/changelog/0.13.1/
    (datetime(2025, 3, 7), "v0.13.1"),
    (datetime.now(), f"now\n({datetime.now().date().isoformat()})"),
]

duration_min = min(r.duration for r in merged_pulls)
duration_max = max(r.duration for r in merged_pulls)
yticks = [
    (duration_min, f"{duration_min / timedelta(seconds=1):.0f} sec. (min)"),
    (timedelta(days=1), "a day"),
    (timedelta(days=3), "3 days"),
    (timedelta(weeks=1), "a week"),
    (timedelta(weeks=2), "2 weeks"),
    (timedelta(weeks=4), "4 weeks"),
    (timedelta(days=30 * 2), "2 months"),
    (timedelta(days=30 * 4), "4 months"),
    (duration_max, f"{duration_max / timedelta(days=30):.2} mon. (max)"),
]

fig, ax = subplots(layout="constrained")
ax.set_title(
    "Pull requests to typst/typst",
    fontsize="xx-large",
    fontweight="black",
)
ax.set_xlabel(
    "Date of creation",
    fontsize="large",
    fontweight="bold",
)
ax.set_ylabel(
    "Duration before merged",
    fontsize="large",
    fontweight="bold",
)

merged_x = [r.createdAt for r in merged_pulls]
merged_y = [r.duration.total_seconds() for r in merged_pulls]
staff_x = [r.createdAt for r in staff_pulls]
staff_y = [r.duration.total_seconds() for r in staff_pulls]

ylim = (0, max(merged_y) * 3)

ax.scatter(merged_x, merged_y, marker="o", color="#239dad", alpha=0.5, s=8)
ax.scatter(staff_x, staff_y, marker="o", color="purple", alpha=0.5, s=8)

for pulls, color in [(closed_pulls, "gray"), (open_pulls, "green")]:
    ax.scatter(
        list(pulls),
        [
            random.uniform(
                yticks[-1][0].total_seconds() * 1.1,
                ylim[1] / 3 * 2.9,
            )
            for _ in pulls
        ],
        marker="o",
        color=color,
        alpha=0.5,
        s=8,
    )

ax.set_yscale("symlog", linthresh=yticks[3][0].total_seconds())
ax.set(
    xlim=(xticks[0][0], xticks[-1][0]),
    xticks=[t for t, s in xticks if s],
    xticklabels=[s for _t, s in xticks if s],
    ylim=ylim,
    yticks=[t[0].total_seconds() for t in yticks],
    yticklabels=(t[1] for t in yticks),
)
ax.set_xticks([t for t, s in xticks if not s], minor=True)

ax.grid(axis="x", which="major")
ax.grid(axis="x", which="minor", linewidth=1 / 4)
ax.grid(axis="y", which="major")

fig.savefig(Path(__file__).with_suffix(".png"))
data.jsonl.7z.pretended-to-be-csv.csv (70.0 KB)
I wish I could plot in typst, but typst doesn’t provide a reliable way to handle date+time objects (parsing ISO format, shifting timezone, etc.) yet…