Tom4
March 5, 2026, 4:03pm
1
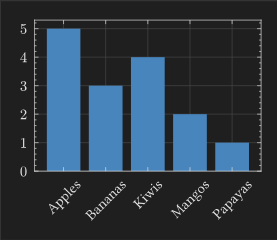
The following code (taken from the documentation ) displays a bar plot with the tick label rotated.
#lq.diagram(
  xaxis: (
    ticks: ("Apples", "Bananas", "Kiwis", "Mangos", "Papayas")
      .map(rotate.with(-45deg, reflow: true))
      .map(align.with(right))
      .enumerate(),
    subticks: none,
  ),
  lq.bar(
    range(5),
    (5, 3, 4, 2, 1)
  )
)
However, the text is still centered with the tick. I’m in a case where the texts are longer, so it would be more readable if the end of the word was aligned with the tick (for example, the s of Apples just below the small black tick).align argument, but it doesn’t change anything to the result…
Thanks :)
flokl
March 5, 2026, 4:40pm
2
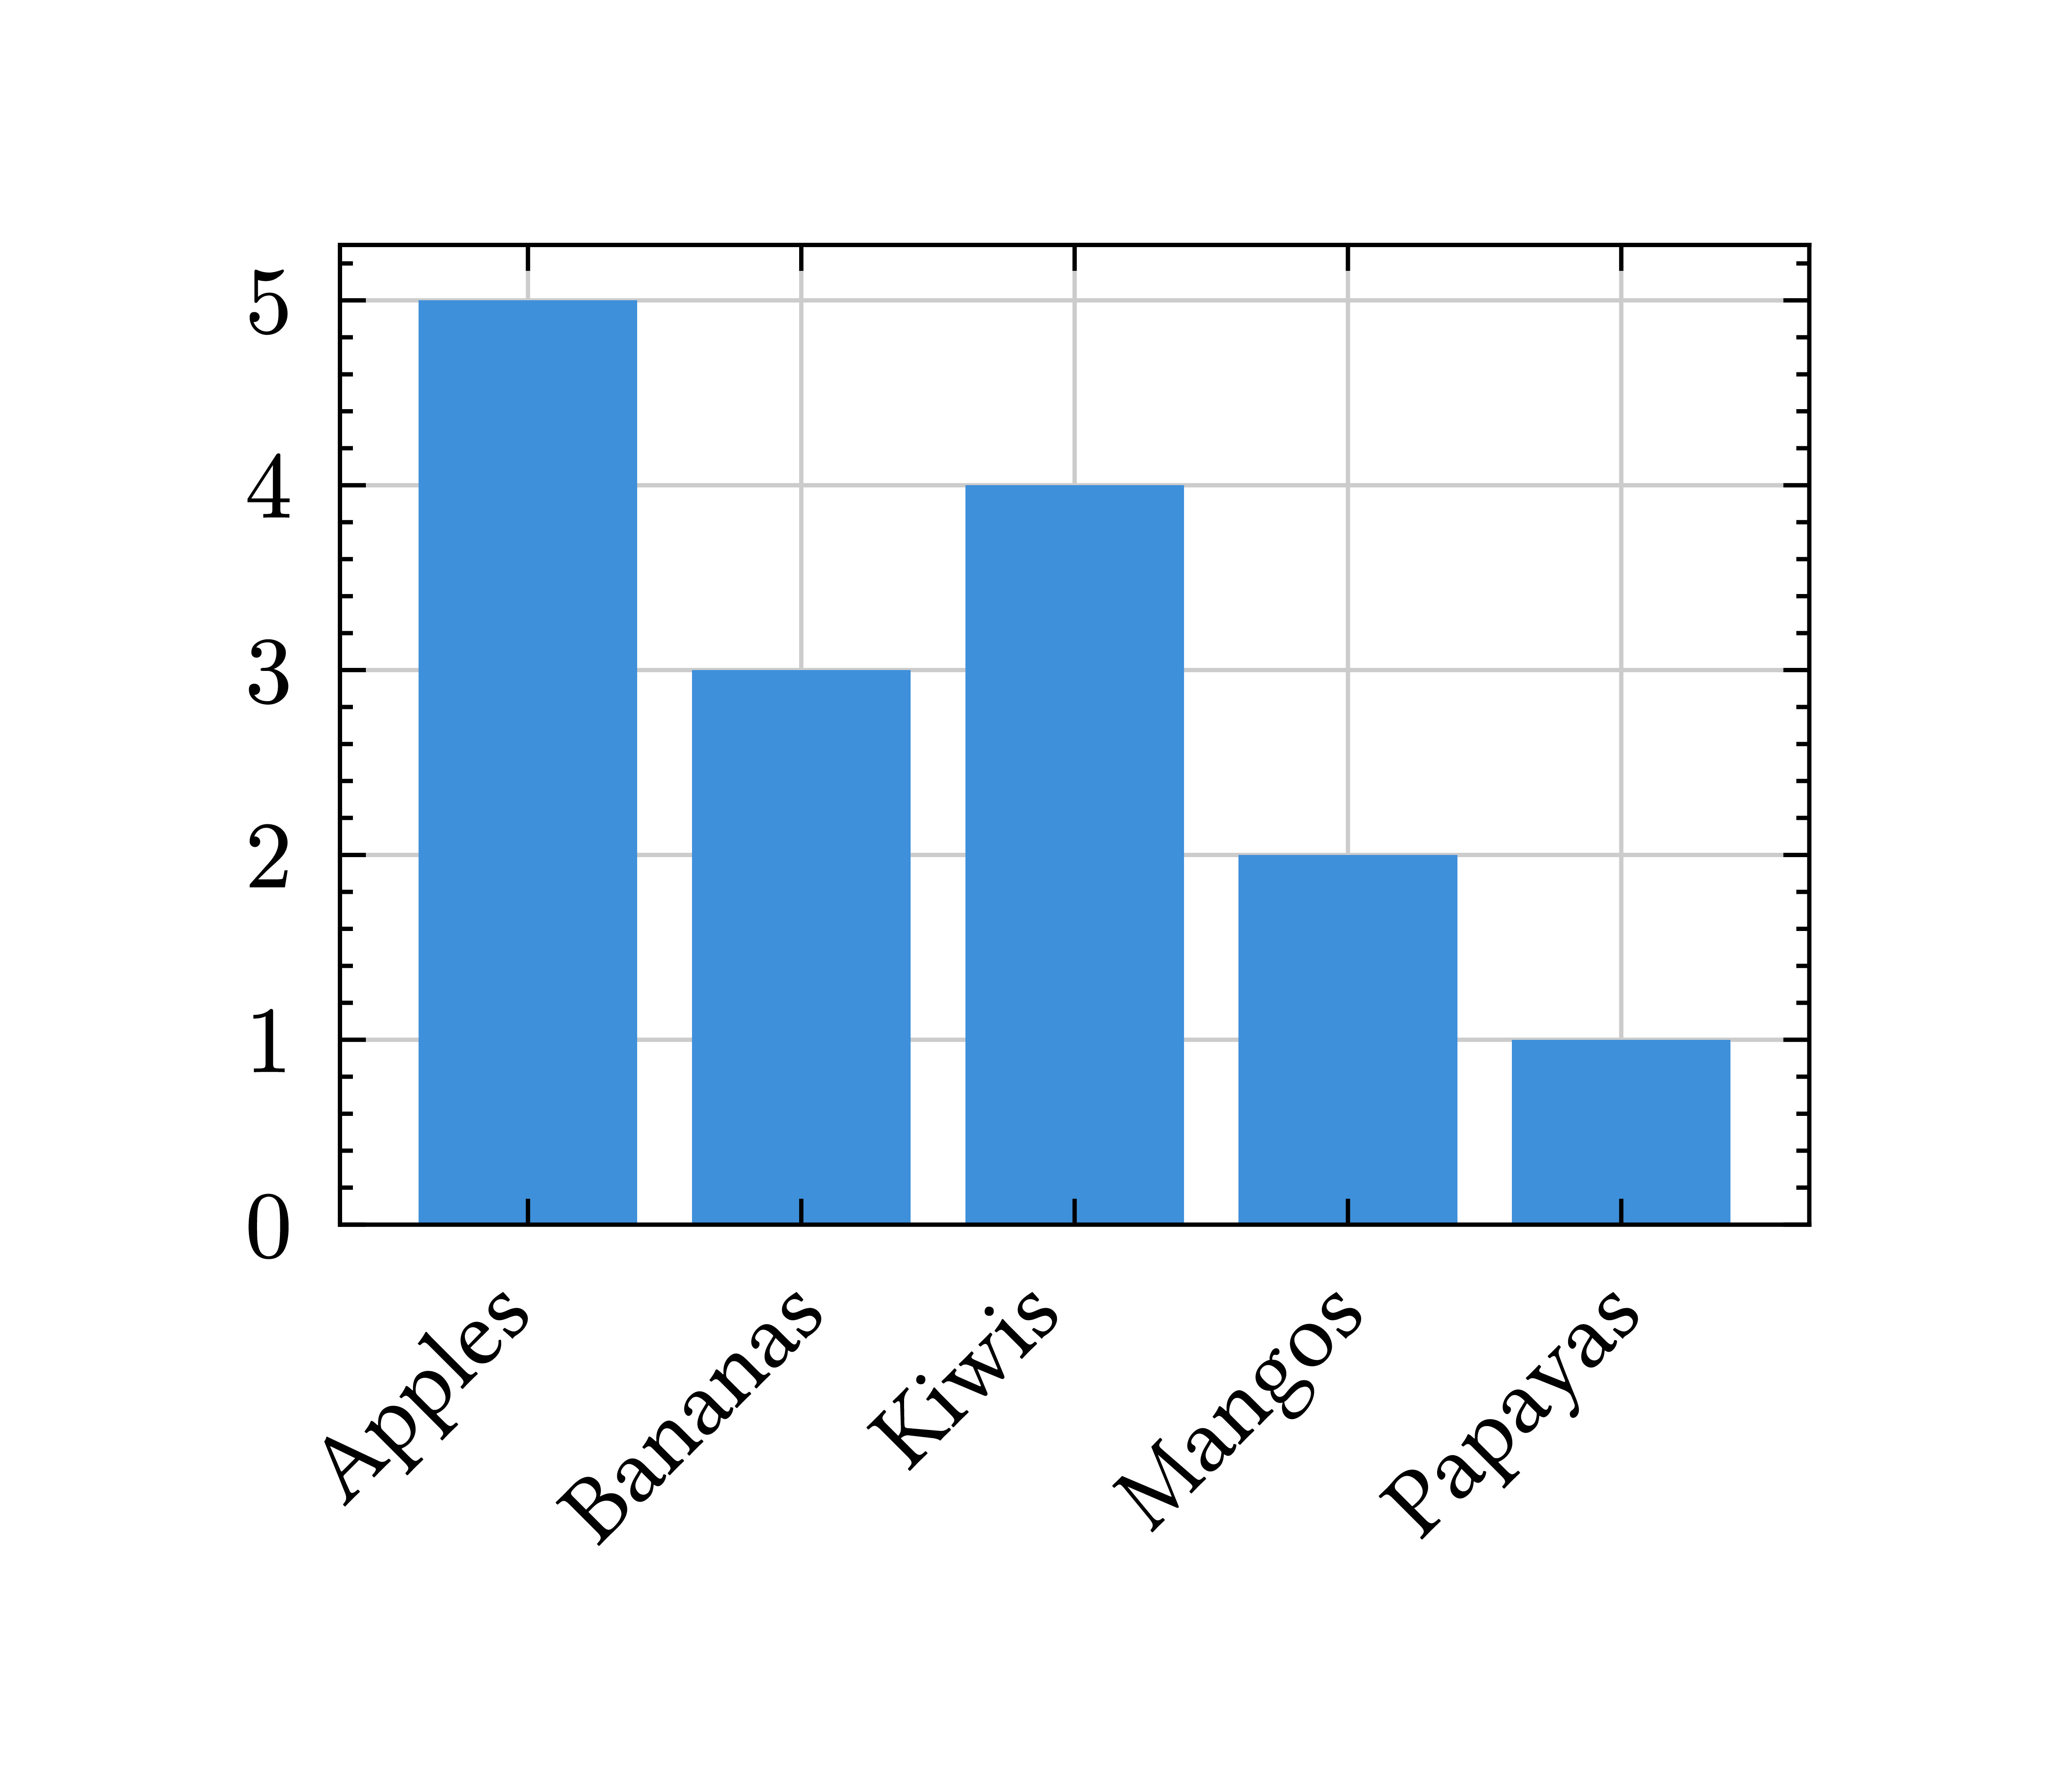
Hi @Tom4 ,
move seems to do the job.
#import "@preview/lilaq:0.5.0" as lq

#lq.diagram(
  xaxis: (
    ticks: ("Apples", "Bananas", "Kiwis", "Mangos", "Papayas")
      .map(rotate.with(-45deg, reflow: true))
      .map(pad.with(left: -9mm))
      .enumerate(),
    subticks: none,
  ),
  lq.bar(
    range(5),
    (5, 3, 4, 2, 1)
  )
)
Edit: okay both
move and
pad work, but I think
move is more correct.
1 Like
Andrew
March 5, 2026, 5:45pm
3
This has been fixed, but not published. [docs] fix bar example with slanted text labels · lilaq-project/lilaq@ba339a9 · GitHub
#import "@preview/lilaq:0.5.0" as lq

#show: lq.show_(
  lq.tick-label.with(kind: "x"),
  it => box(
    width: 0pt,
    align(right, rotate(-45deg, reflow: true, it)),
  ),
)

#lq.diagram(
  xaxis: (
    ticks: ("Apples", "Bananas", "Kiwis", "Mangos", "Papayas").enumerate(),
    subticks: none,
  ),
  lq.bar(
    range(5),
    (5, 3, 4, 2, 1),
  ),
)
4 Likes