Hi,
I (with the help of coding agents) been working on tytable, a lightweight Python package that turns Polars DataFrames into typst tables. It is heavily inspired by the wonderful tinytable R package.
It has a chainable API for formatting, styling, row/column groups, themes, notes, and embedded images or sparklines. It can also show an HTML preview in Jupyter, while the main output stays native typst that you can include in a larger document.
Here’s a quick example for a given Polars DataFrame called data:
tt(data, caption="Benchmark results (demo data)")
.group(j={"Scores": ["Q1", "Q2"]})
.fmt(j=["Q1", "Q2"], digits=1)
.style(i="header", bold=True, color="white", background="#334155")
.style(i=2, bold=True, color="#15803d", background="#dcfce7")
.save("example_table.typ")
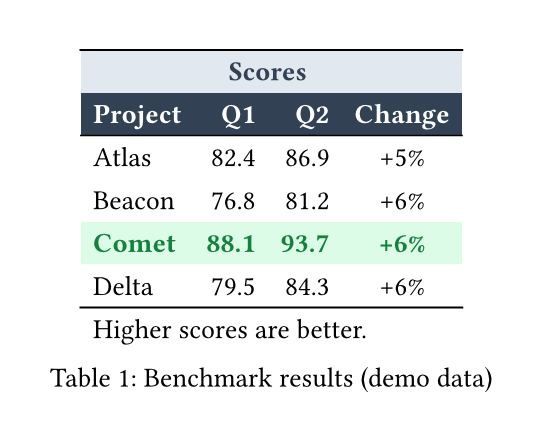
Just #include the saved file it into your typst document.
You can find (way) more examples in the documentation (also linked on GitHub).
I was building a pipeline to generate daily reports which consist mainly of tables. So I needed a way to get data from Python (where I load, clean an aggregate it) into nicely formatted typst tables. Before, I did everything in R because of the above mentioned tinytable package. But I’ve hit some limitations with R so I built tytable. In contrast to tinytable, this package has a strict focus on typst and is also quite a bit faster (x10 but that only matters for large tables with lots of formatting).
And yes, this was built almost entirely with AI. While I know some Python, building a packages like this would be beyond my capabilities (and time) without AI. I understand completely if this is a deal breaker for you.
GitHub: https://github.com/EinMaulwurf/tytable
PyPI: https://pypi.org/project/tytable/