The documentation demonstrates multiple plots in a diagram by listing the lq.plot(...), calls as arguments to lq.diagram (i.e. separated by commas). If one wants to plot multiple lines in a loop, is there a way to do so? For example, consider the code below:
#let loop_lq(A) = {
import "@preview/lilaq:0.2.0" as lq
let xs = lq.linspace(0, 1, num: 11)
let fn(x, a: 0.0) = calc.sin(a * x)
lq.diagram(
width: 10cm,
height: 5cm,
ylim: (0, auto),
xlim: (0, 1),
legend:(position: left+top),
for a in A {
lq.plot(
xs, mark: none,
xs.map(t => fn(t, a:a)),
stroke: (paint: colors.tertiary.lighten(25%).rotate(calc.log(a)*40deg), thickness: 3pt),
//tip: tiptoe.stealth,
//toe: tiptoe.bar,
label: [$a = #a$],
)
}
)
}
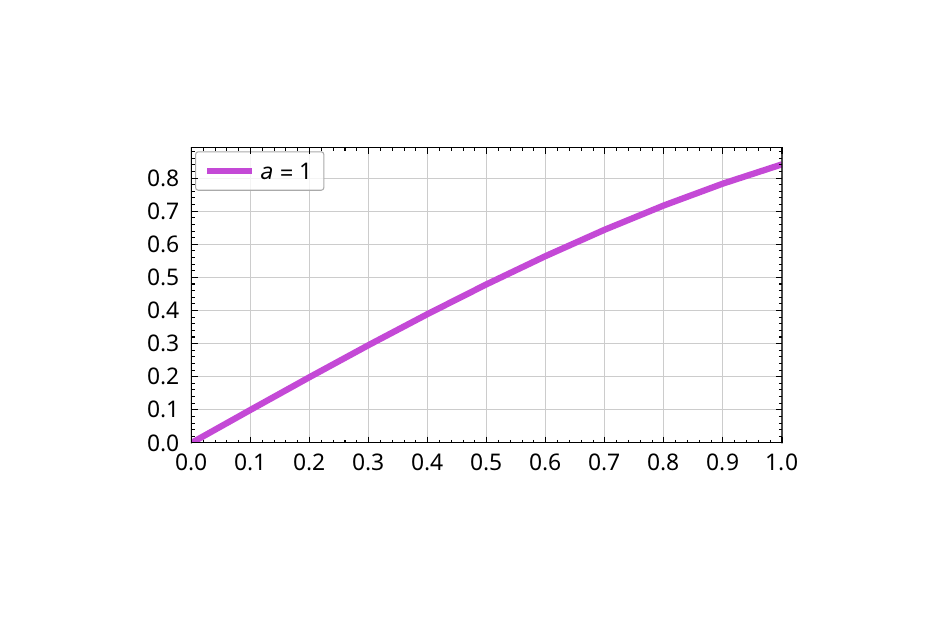
#loop_lq((0.1, 1.0))
This produces an output which is missing all but the last iteration.