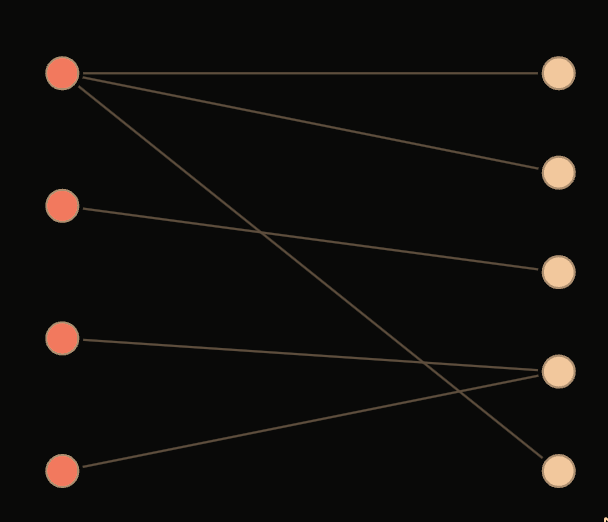
Here is one basic way, using fletcher:
#import "@preview/fletcher:0.5.8": diagram, node, edge

#let (c1, c2) = (red.mix(orange), orange.mix(yellow))

#let dot(pos, color, name, ..args) = node(pos, radius: 5pt, fill: color, name: name, ..args)

#diagram(
  node-stroke: 0.5pt,
  node-outset: 2pt,
  spacing: (20mm, 5mm),

  dot((0,0.5), c1, <a1>),
  dot((0,1.5), c1, <a2>),
  dot((0,2.5), c1, <a3>),
  dot((0,3.5), c1, <a4>),

  dot((1,0), c2, <b1>),
  dot((1,1), c2, <b2>),
  dot((1,2), c2, <b3>),
  dot((1,3), c2, <b4>),
  dot((1,4), c2, <b5>),

  edge(<a1>, "-|>", <b1>),
  edge(<a1>, "-|>", <b5>),
  edge(<a1>, "-|>", <b2>),
  edge(<a2>, "-|>", <b3>),
  edge(<a3>, "-|>", <b4>),
  edge(<a4>, "-|>", <b4>),
)
If you have lots of similar diagrams like this, you could probably write a function that takes in a data structure like a dictionary and produces a diagram automatically. To give you a hint in the right direction, you can add for loops into diagrams like so:
#diagram(
  node-stroke: 0.5pt,
  node-outset: 2pt,
  spacing: (20mm, 5mm),

  for y in range(5) {
    dot((0,y), c1, "a" + str(y))
  },

  for y in range(5) {
    dot((1,y), c2, "b" + str(y))
  },

  for (src, tgt) in (
    (0, 1),
    (1, 1),
    (3, 2),
    (3, 3),
  ) {
    edge(label("a" + str(src)), label("b" + str(tgt)), "-|>")
  }
)