This is right! To elaborate further, by default the height of each row is auto, which means it will have the height of its tallest cell.
For rowspan = 1 cells that should be pretty clear. For example, if a row has a bunch of cells with a height of 1 cm and one cell with a height of 2 cm, the row’s height will then be 2 cm.
Cells with rowspan > 1, however, are different. They do not automatically affect the height of all spanned auto rows. Just think about it: if it had a height of 2 cm and spanned two auto rows, like in your example tables, how much of those 2 cm should go to each row? 1 cm to the row above and 1 cm to the one below? All 2 cm above? All 2 cm below?
It’s not obvious, so we chose that they only affect the height of the last spanned auto row. This means that the second auto row will see a cell of height (2 cm - height of previously spanned rows) when calculating its tallest cell. The first auto row however will ignore the rowspan.
This choice was made because it minimizes the total height of the rowspan - if we chose the first auto row, for example, it’d be too early to tell the height of other spanned rows in order to adjust the auto row’s height so that it doesn’t grow larger than necessary.
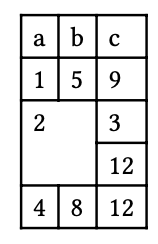
This means that, in the first example, the first auto row has a height of measure[3].height (in Typst syntax) since the rowspan [2] is ignored. However, the second auto row has a height of calc.max(measure[2].height - measure[3].height, measure[12].height), which is equal to measure[12].height, since the rowspan is now considered but ignoring the height from previously spanned rows.
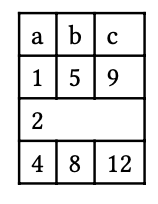
In the second example, however, there are no cells other than the rowspan in each of the two rows in question, so you get a height of 0cm for the first row (calc.max(/*nothing*/)) and a height of calc.max(measure[2].height - 0cm) (aka measure[2].height) for the second.
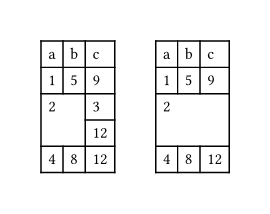
Note how it changes if you set a fixed size for each row with rows: 0.64cm:
#stack(
  dir: ltr,
  table(
    rows: 0.64cm,
    columns: (auto, auto, auto),
    table.header(
      [a], [b], [c],
    ),
    [1], [5], [9],
    table.cell(colspan: 2, rowspan: 2)[2], [3],
    [12],
    [4], [8], [12],
  ),
  1cm,
  table(
    rows: 0.64cm,
    columns: (auto, auto, auto),
    table.header(
      [a], [b], [c],
    ),
    [1], [5], [9],
    table.cell(colspan: 3, rowspan: 2)[2],
    [4], [8], [12],
  )
)
Hope it’s clear now!