#import "@preview/cetz:0.4.0"
#cetz.canvas(length: 1cm, {
  import cetz.draw: *

  scale(x: 3, y: 1)

  set-style(stroke: (cap: "round", thickness: 3pt), padding: 10pt)

  line((-5, 0), (5, 0), name: "xaxis", mark: (end: "triangle"), stroke: (paint: gray))
  content((), $ Re(z) $, anchor: "west")

  line((0, -12), (0, 12), name: "yaxis", mark: (end: "triangle"), stroke: (paint: gray))
  content((), $ Im(z) $, anchor: "south")

  content((0, 0), $ O $, anchor: "north-east")

  line((), (120deg, 3), stroke: (paint: orange))
  mark((120deg, 3), (0, 0), anchor: "center", symbol: "o", stroke: orange, fill: orange)
  content((120deg, 3), anchor: "south-west", padding: 10pt)[#text(fill: orange)[$ xi = 3 e ^(i (2 pi)/3) = r e^(i theta) $]]
})
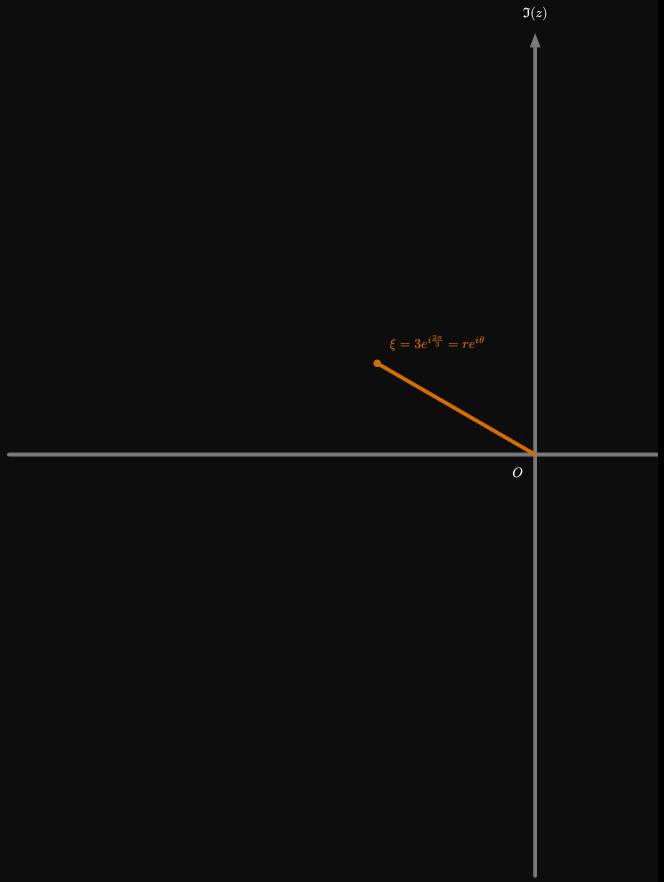
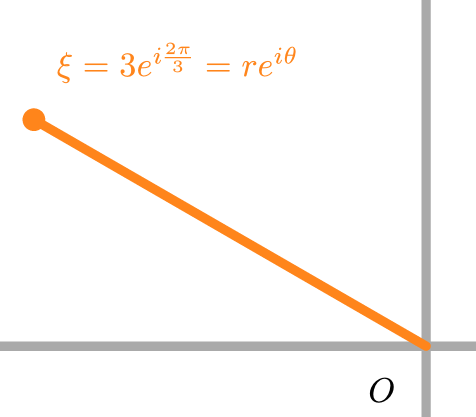
This is my MWE. I have different x and y scales because of the way the data are spread. I want a circle rather than an ellipse at the end of the line.
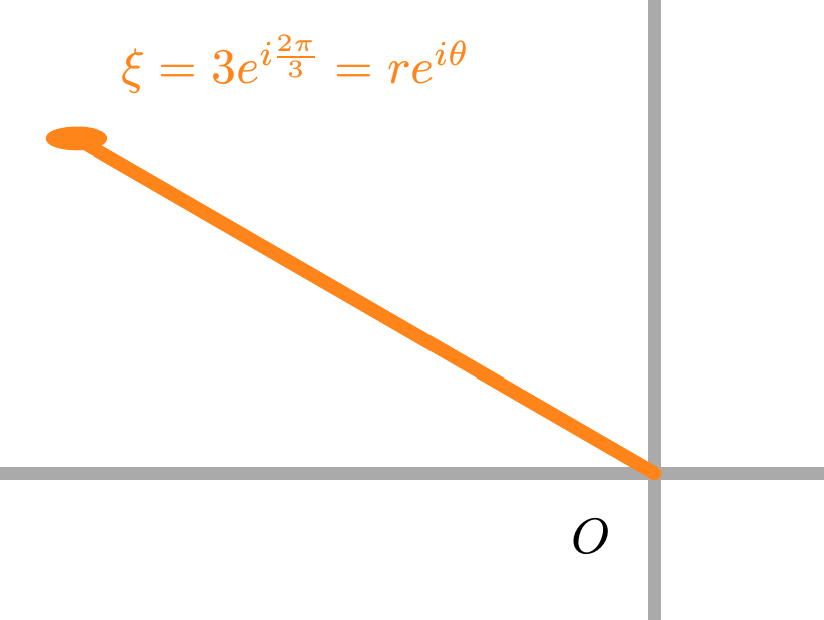
How do I get an undistorted version of whatever marker or shape I use, given my unequal scales?