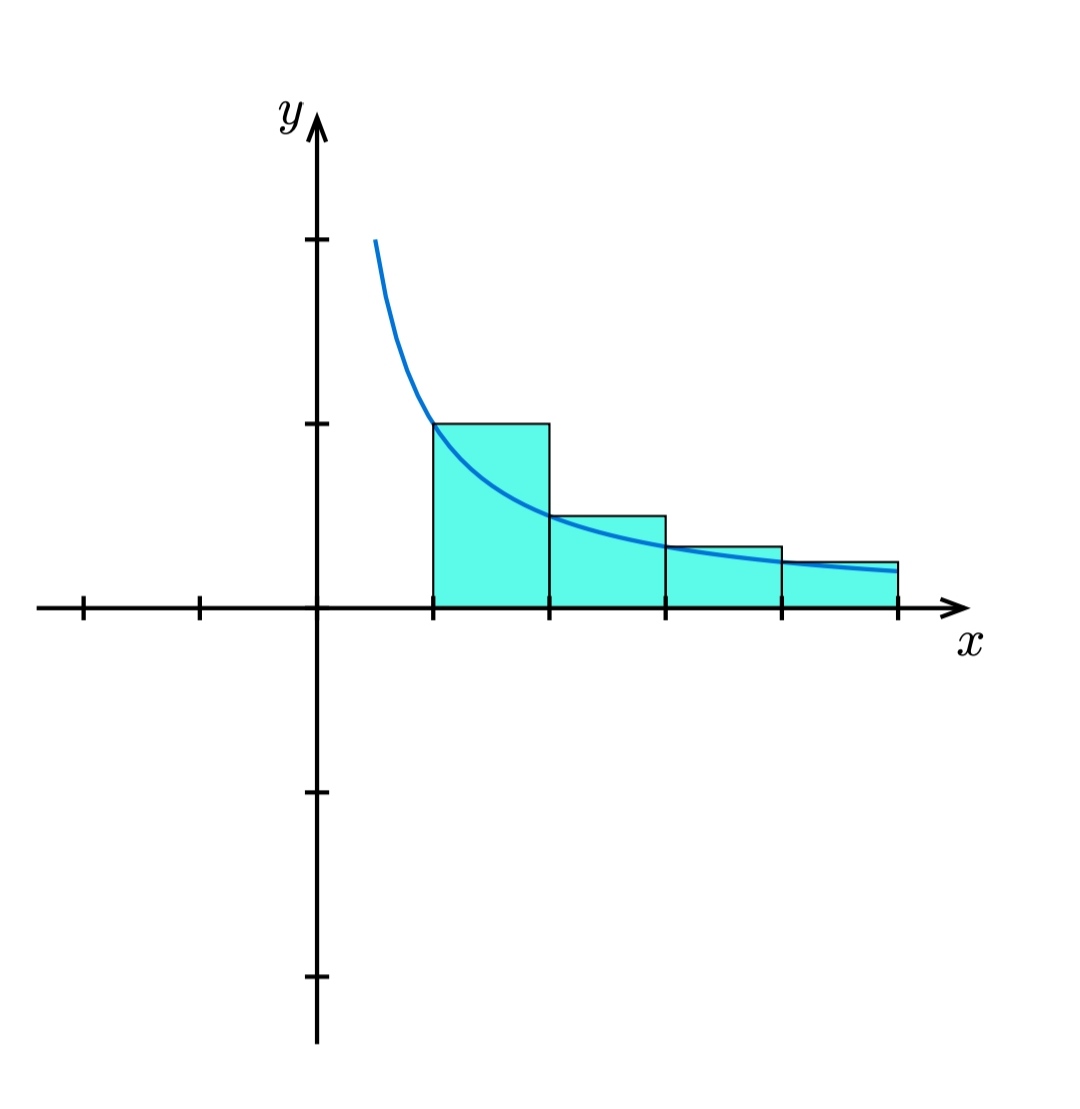
let f(x) = 1/x,
    for x_val in range(1, 5){
    let h = f(x_val)
    plot.add-fill-between(
    domain: (x_val,x_val+1),
    x => h,
    f,
    style:(fill:green)
  )}
Hello @Golden-Ratio, and welcome to the forum.
If you could please edit your post to state your question inside the post, and reduce the length of the title, it will make it easier to read.
Also, you will notice that most questions are answered quickly on the forum, especially when questions are accompanied with a minimum working example (MWE).
In your case, the code you have posted does not compile and requires some packages like CeTZ and CeTZ-Plot.
If you could please edit your post to include some additional code so forum members can copy and paste your code directly, you are more likely to get some help.
In the meantime, I would suggest looking at some posts like How can I shade the region between two functions? where the same kind of question is asked. Notice the MWE provided.
Example of a MWE that includes `plot.add-fill-between`
#import "@preview/cetz:0.4.2"
#import "@preview/cetz-plot:0.1.3"
#cetz.canvas({
  import cetz.draw: *
  import cetz-plot: *

  plot.plot(size: (2, 2), x-tick-step: none, y-tick-step: none, {
    plot.add-fill-between(
      domain: (0, 2 * calc.pi),
      calc.sin, // First function/data
      calc.cos, // Second function/data
    )
  })
})
3 Likes