From How to Reproduce an Image in Typst? - #7 by Andrew, I thought I can do shared-zero from CeTZ, but I can’t find such option. Does it exist?
No, there is no such option but you can install a tick filter for the y axis to remove the 0 tick. This should result exactly in the looks of the initial figure from that blog post.
#lq.diagram(
  yaxis: (filter: (value, _) => value != 0)
)
This is explained in Axis configuration − Lilaq.
2 Likes
Okay, but can I then offset this one label to the left so that it looks like a merged zero?
In this case I suggest omitting both zeros and using place − Lilaq to manually add a 0 at the position of your liking.
#lq.diagram(
  xaxis: (filter: (value, _) => value != 0),
  yaxis: (filter: (value, _) => value != 0),
  lq.place(
    0, 0, move(dx: -.75em, dy: .75em)[$0$]
  )
)
With show tick.where(value: 0): move(dx: 1em) this will one day be easy with user-defined types.
Hmm. While this works
#import "@preview/lilaq:0.2.0" as lq
#let omit-zero = (filter: (v, _) => v != 0)
#let shared-zero = {
lq.place(0, 0, align: top + right, move(dx: -0.5em, dy: 0.5em)[$0$])
}
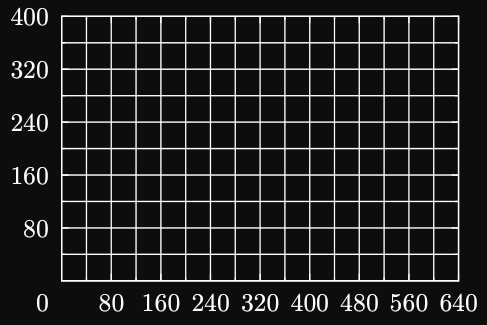
#let y-max = 400
#let x-max = 640
#lq.diagram(
ylim: (0, y-max),
xlim: (0, x-max),
yaxis: (ticks: range(y-max + 1, step: 80), subticks: 1, ..omit-zero),
xaxis: (ticks: range(x-max + 1, step: 80), subticks: 1, ..omit-zero),
grid: (stroke: black, stroke-sub: 0.5pt),
shared-zero,
)
I wanted to get a single variable that will do both things and just spread it. But for that you need to fold the axis dictionaries. Is there some way to do that?
Do you mean
#let shared-zero = arguments(
  xaxis: (..),
  yaxis: (..),
  lq.place(0, 0, align: top + right, move(dx: -0.5em, dy: 0.5em)[$0$])
)

#lq.diagram(
  ..shared-zero
)
By the way: I believe one always needs to embrace the utilized medium to some amount. With handwritten notes for example you can do different things than with a computer. One is easily tempted to copy habits from one medium to another but it is also appropriate to adapt style to what’s given.
An example are arrows on top of variables for denoting vectors. They are pretty and work well when handwritten but in print, it just works better to use bold, upright letters in most cases (LaTeX for example is notoriously bad with vector arrows, they’re always clashing with parentheses and stuff).
Omitting zeros is a thing that often needs manual tailoring and as soon as the two axes don’t start exactly at zero, it gets awkward.
This is a matter of taste of course and I’m not here to teach style − quite the contrary I’m very happy to battle-test Lilaq for possible features − but in this case I don’t necessarily think that the two zeros look bad (if you want my opinion). In How to reproduce a stress diagram image in Typst? - Questions - Typst Forum, it btw looks like the 0 is the regular one from the x-axis and just the one from the y-axis is missing.
1 Like
Yes, but with folding magic.
There is no space for Y axis zero regardless.
What do you mean by “folding the axis dictionaries”?
I have (ticks: range(x-max + 1, step: 80), subticks: 1) and I need to merge it with (filter: ...). But you can’t do this all in one sweep without some trick.
I guess the only solution would be to pass axis settings to a function that will add shared zero stuff. But semantically, this doesn’t make sense.
Ah, so you want to separate the “share the zero” from “display these particular ticks”. How about:
#show: lq.set-diagram(
  xaxis: (filter: (value, _) => value != 0),
  yaxis: (filter: (value, _) => value != 0)
)

#let shared-zero = {
  lq.place(0, 0, align: top + right, move(dx: -0.5em, dy: 0.5em)[$0$])
}

#lq.diagram(
  ylim: (0, 400),
  xlim: (0, 640),
  xaxis: (tick-distance: 80, subticks: 1),
  yaxis: (tick-distance: 80, subticks: 1),
  shared-zero,
)
Different to cetz-plot, the property axis.ticks should only be used as a last resort since this approach does not react to changes in the data − there are many ways to deal with this in other ways like axis.tick-distance or passing something like (density: 80%) to axis.tick-args.
But I know, the ticking tutorial has not been written yet and so there is no proper guide on these matters currently …
1 Like
Oh… set rules… I guess this works. They should fold everything correctly, because I remember how @PgBiel worked on this.
#import "@preview/lilaq:0.2.0" as lq

#let omit-zero = (filter: (v, _) => v != 0)
#let shared-zero = {
  lq.place(0, 0, align: top + right, move(dx: -0.5em, dy: 0.5em)[$0$])
}

#show: lq.set-diagram(yaxis: omit-zero, xaxis: omit-zero)

#lq.diagram(
  ylim: (0, 400),
  xlim: (0, 640),
  yaxis: (tick-distance: 80, subticks: 1),
  xaxis: (tick-distance: 80, subticks: 1),
  grid: (stroke: black, stroke-sub: 0.5pt),
  shared-zero,
)
This looks… pretty damn good. I just need to get used to this set rules stuff. Some things here, other things there.
Yep :) you can even configure the grid through a set rule:
#show: lq.set-grid(stroke: black, stroke-sub: 0.5pt)
Could be one that’s worth it. I’ve just no idea how to bring the shared-zero in without doing it manually. But still, it’s not too bad now.
I know, I already used it in one of our other million threads today.
1 Like