How to reproduce a stress diagram image in Typst?

Hi everyone,

I’m trying to recreate a stress diagram in Typst that includes:

  • A grid with labeled axes (Normal stress vs. Shear stress)
  • A straight line representing a failure envelope (starting from the cohesion intercept)
  • Several circular data points along the line
  • An annotated point labeled (320, 138)
  • A text box in the top-right corner showing c = 34 kN/m² and ϕ = 20°

Here’s the reference image I’m trying to replicate:


I’ve started writing some code using lilaq

#import "@preview/lilaq:0.1.0" as lq

#let xs = (100, 200, 300, 400)

#lq.diagram(
  width: 15cm, 
  height: 7cm,
  ylim: (30, 350),
  xlim: (0, 450),
  margin: (x: 5%),
  title: [Data],
  xlabel: $sigma_n | k N\/m^2$, 
  ylabel: $tau | k N\/m^2$,

  lq.scatter(xs, (72.2, 105.6, 144.4, 177.7), mark: "s", label: [A]),
 
)

Thanks a lot in advance for your help!

Hi there @TlidYou,

Nice job getting accustomed to using Lilaq. It is worth mentioning that Lilaq is now v. 0.3.0 and should be imported using:

#import "@preview/lilaq:0.2.0" as lq //0.3.0 waiting for PR to be released

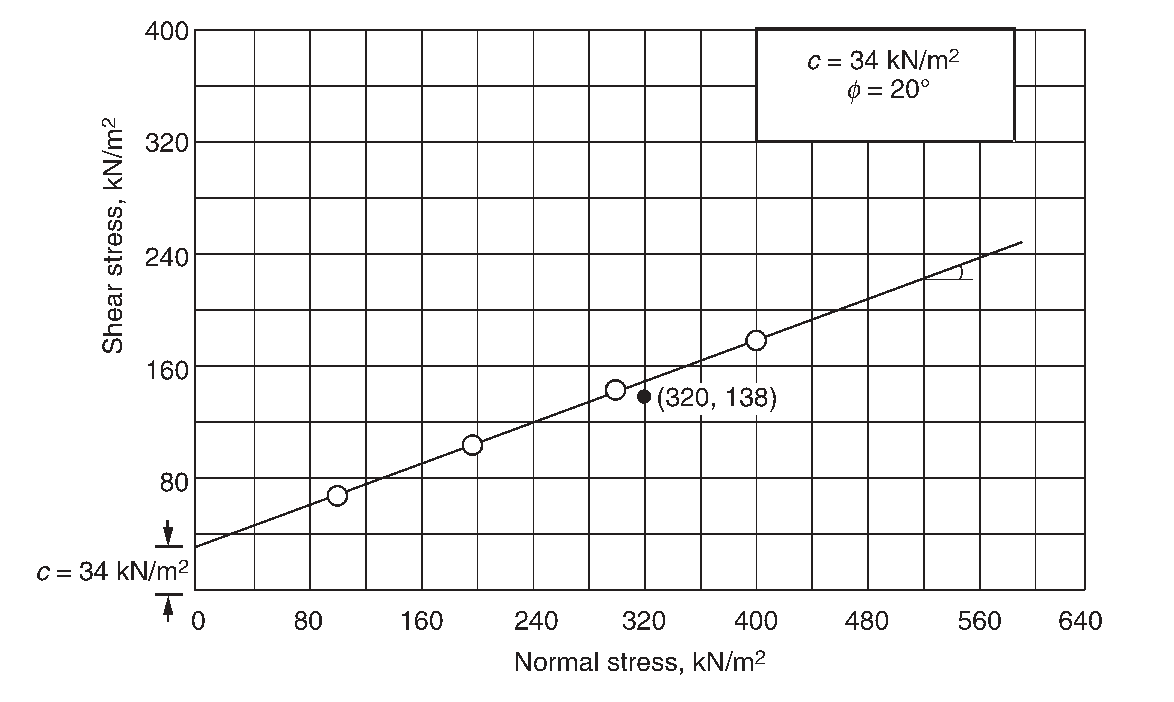
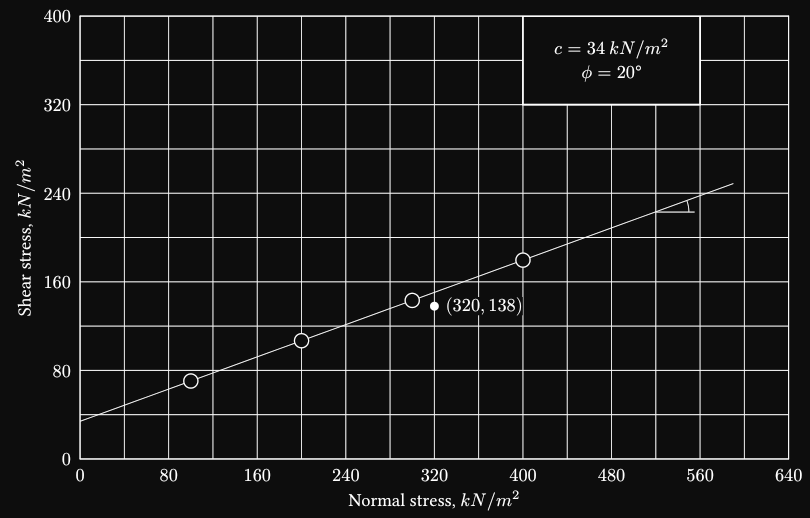
What can we help you with exactly? Your question is obviously about reproducing the image, but it seems what you are looking for is some advice on how to use Lilaq for that purpose, am I correct?

If so, could you please give a more precise description of what you are looking for (change Marks − Lilaq for example) and how we can help?

Or are you just looking for someone to replicate the whole thing for you instead?

Also please tag your question with the appropriate tags (such as lilaq) for traceability.

1 Like

Hi @vmartel08
As a new Typst user, my goal was to draw a line starting at the point (0,34) with a slope defined by a 20° angle.

It is version 0.2.0.

Yes, my bad, the lilaq:0.3.0 by Mc-Zen · Pull Request #2338 · typst/packages · GitHub has not been released on Universe yet.

You seem to have a good start for the labels and dimensions. Try:

#lq.diagram(
  lq.plot(
    range(640),
    range(640).map(x => 1/2.7475 * x + 34),
    every: 100
  ),
  lq.scatter((320,),(138,), mark: "o"),

  lq.place(95%, 20%, align: right, box(stroke: 1pt, inset: 2pt, [Some text \ and more])
  ),
)

Hi. I have no idea how to make accurate arcs other than using CeTZ, so this is why I use it here (although I guess you don’t need it anyway):

#import "@preview/lilaq:0.2.0" as lq
#import "@preview/cetz:0.3.4"

#let slope = 20deg
#let f(x) = calc.tan(slope) * x + 34

#show: lq.set-tick(inset: 0pt)
#show: lq.set-grid(stroke: black, stroke-sub: 0.5pt)
#show: lq.set-diagram(cycle: (
  it => {
    set lq.style(stroke: 0.5pt + black)
    it
  },
))

// In the future, can be set with set lq.mark(stroke: black, fill: white)
#let lq-scatter = lq.scatter.with(stroke: black, color: white)
// In the future, can be set with set lq.style(stroke: black, fill: white)
#let lq-rect = lq.rect.with(stroke: black, fill: white)

#let point(x, y, size: 3mm, color: black, align: left, offset: 0.6em) = {
  let body = {
    set text(top-edge: "bounds", bottom-edge: "bounds")
    box(fill: white)[$(#x, #y)$]
  }
  (
    lq.scatter((x,), (y,), size: size, color: color),
    lq.place(x, y, align: align, pad(offset, body)),
  )
}

#let y-max = 400
#let x-max = 640
#lq.diagram(
  width: 15cm,
  height: 15cm * y-max / x-max,
  ylim: (0, y-max),
  xlim: (0, x-max),
  yaxis: (tick-distance: 80, subticks: 1),
  xaxis: (tick-distance: 80, subticks: 1),
  xlabel: [Normal stress, $k N\/m^2$],
  ylabel: [Shear stress, $k N\/m^2$],

  let xs = lq.linspace(0, 590),
  lq.plot(xs, xs.map(f), mark: none),

  lq.line((520, 223), (555, 223), stroke: 0.5pt),
  lq.place(520, 223, cetz.canvas({
    cetz.draw.circle((0, 0), radius: 0.8, stroke: 0pt) // Positioning hack.
    let arc = cetz.draw.arc.with(anchor: "origin")
    arc((0, 0), start: 0deg, delta: slope, radius: 0.7, stroke: 0.5pt)
  })),

  let xs = (100, 200, 300, 400),
  lq-scatter(xs, xs.map(f), size: 6mm),
  // Coordinate-based size can be achieved with ellipse in the future.

  ..point(320, 138),

  lq-rect(400, 320, width: 160, height: 80),
  lq.place(400 + 80, 320 + 40)[
    #set par(leading: 0.4em)
    $
      c = 34 med k N\/m^2 \
      phi.alt = 20 degree \
    $
  ],
)

With the upcoming Lilaq version, some stuff probably can be simplified, or maybe even right now.

2 Likes

Thank you @Andrew and @vmartel08 for your time.

2 Likes

Is there a way to achieve this with Lilaq @Mc-Zen? The CeTZ solution is quite easy to implement but I could not reproduce it with Lilaq…

You could use lq.path to draw the arc manually I guess. I don’t know, would it be worth to add an arc primitive to Lilaq? Maybe. Using tiptoe, this wouldn’t be too hard.

I think so. I had to use it here too, though that was fully with CeTZ. I don’t know how common arcs are on diagrams, but I guess sometimes they are used.