#import "@preview/cetz:0.3.4"
#set page(width: auto, height: auto, margin: .5cm)

#set text(8pt)
#cetz.canvas(length: 1cm, {
  let olive = rgb("#a5a552")

  let pattern(degree, width: 10cm, dx: 0pt) = tiling(size: (width, 10cm), {
    let rect = rect(width: 8pt, stroke: olive)
    let rail = tiling(size: (11pt, 4pt), place(dx: 0.5pt, rect))
    rotate(degree, move(dx: dx, block(width: width, height: 10cm, fill: rail)))
  })

  import cetz.draw: *

  let draw-slope(pos, deg) = {
    line(pos, (rel: (1.5, 0)), name: "l")
    let label = $beta = #calc.round(deg.deg()) degree$
    content((rel: (0.3, -0.2), to: "l.mid"), text(0.8em, label))
    let mark = (symbol: ">", width: 4pt, scale: 0.4)
    arc("l.end", radius: 1.5, start: 0deg, stop: deg, mark: mark)
  }

  let draw-pattern(from, to, height: 0.3, pattern) = line(
    (rel: (0, -height), to: from),
    (rel: (0, height)),
    to,
    (rel: (0, -height)),
    close: true,
    stroke: none,
    fill: pattern,
  )

  let soil-info(name, body) = content(name, {
    set align(center)
    set par(spacing: 0.5em)
    set par(leading: 0.3em)
    underline(emph(name))
    parbreak()
    body
  })

  let height = 6
  let gravier-height = 2
  let beta = 20deg
  let slope = (beta, 5)

  // Sable background
  line(
    (0, gravier-height),
    (0, height),
    (rel: slope),
    (rel: (0, -(height - gravier-height))),
    fill: rgb("#ece9c0"),
    stroke: none,
    close: true,
    name: "Sable",
  )

  draw-slope("Sable.32%", beta)
  draw-pattern("Sable.25%", "Sable.31%", pattern(5deg, dx: -12mm))
  draw-pattern("Sable.42%", "Sable.49%", pattern(5deg, dx: -12mm))

  soil-info("Sable")[
    $
          gamma & = 18 [k N\/m^3] \
           phi' & = 30 degree     \
      K_(r a_1) & = 0.441         \
    $
  ]

  // Gravier background
  line(
    (0, 0),
    (0, gravier-height),
    (rel: slope),
    ((), "|-", (0, 0)),
    fill: rgb("#c7e6c7"),
    stroke: none,
    close: true,
    name: "Gravier",
  )

  draw-slope("Gravier.28%", beta)

  soil-info("Gravier")[
    $
          gamma & = 21 [k N\/m^3] \
           phi' & = 40 degree     \
      K_(r a_2) & = 0.266         \
    $
  ]

  // Right-side lines
  line((0, height), (rel: slope), stroke: olive)
  line((0, gravier-height), (rel: slope), stroke: red)

  // Left-side lines
  let right-length = 3
  line((0, 0), (rel: (-right-length, 0)), name: "l", stroke: olive)
  draw-pattern("l.12%", "l.90%", pattern(30deg, width: 25.8mm, dx: -28.8mm))
  line((0, height), (rel: (-right-length, 0)))

  let dimention-text(at, body) = {
    content(at, box(fill: white, inset: 0.1em, body))
  }
  let dimention-line(..args) = {
    let s = (symbol: ">", fill: black, stroke: (miter-limit: 100), width: 0.5mm)
    line(mark: s, ..args)
  }

  let x = -right-length + 0.2
  dimention-line((x, 0), (x, height), name: "H")
  dimention-text("H.mid")[$"H" = height thin "m"$]

  let x = -right-length / 2

  anchor("C", (rel: (-0.1, -0.1), to: (0, height)))
  content("C", anchor: "north-east")[$C$]

  dimention-line((x, gravier-height), (x, height), name: "z1")
  let pos = (rel: (-0.3, 0), to: "z1.mid")
  dimention-text(pos)[$z_1 = #(height - gravier-height) thin "m"$]

  line((0, gravier-height), (rel: (x - 0.1, 0)))

  anchor("B", (rel: (-0.1, -0.1), to: (0, gravier-height)))
  content("B", anchor: "north-east")[$B$]

  dimention-line((x, 0), (x, gravier-height), name: "z2")
  let pos = (rel: (-0.3, 0), to: "z2.mid")
  dimention-text(pos)[$z_2 = #gravier-height thin "m"$]

  anchor("A", (rel: (-0.1, -0.1), to: (0, 0)))
  content("A", anchor: "north-east")[$A$]

  line((0, 0), (0, height), stroke: 1.5pt)
})
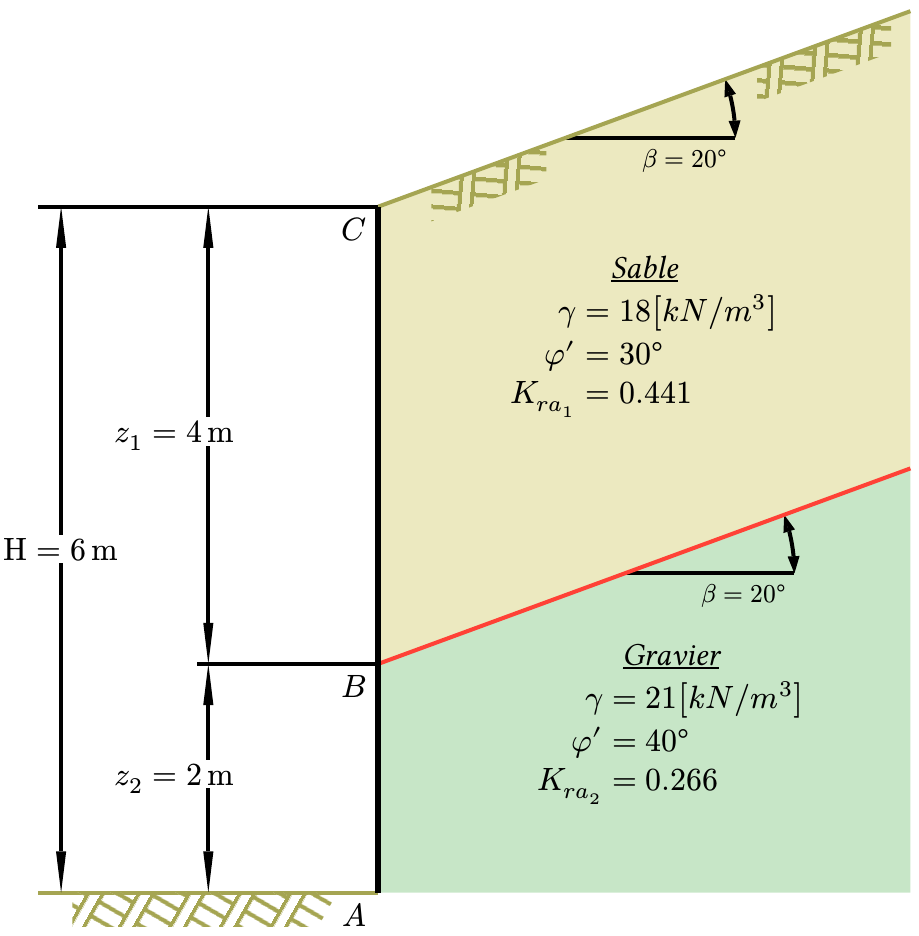
Output
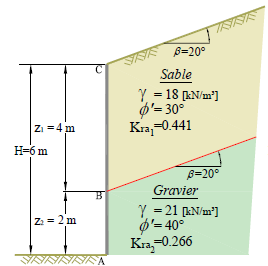
You can change these variables and pretty much everything will automatically adapt to new values:
  let height = 6
  let gravier-height = 2
  let beta = 20deg
  let slope = (beta, 5)
  let right-length = 3
The only thing that doesn’t work great is the pattern. It is pretty complex in terms of transformation, so I don’t know how to make it more adaptable. I also tried to copy the start/end look from the original image.
You can play with global length and font size to get better scaling of things.