I am trying to use a #table to create timeline looking content in my document. The first column in the table indicates the year and the second column includes content of varying lengths.
I want to be able to draw a line from the bottom of the year text in one cell (e.g., 2025) to the bottom of the cell (i.e., up until the start of the next year cell, 2024) to create the effect of a timeline.
I can’t seem to get the table.cell size because it isn’t working as desired.
Here are my two attempts so far:
#set text(size: 12pt)
// Does not work as desired
#table(
columns: (1fr, 10fr),
stroke: none,
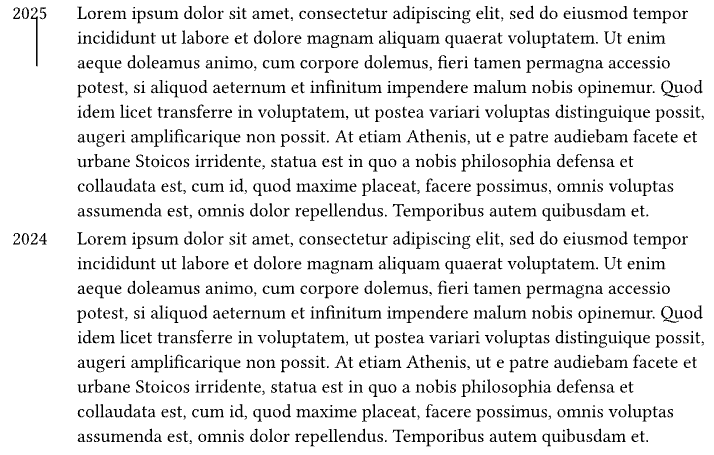
[2025 #rotate(90deg)[#line(length: 100%)]], lorem(100),
[2024], lorem(100)
)
I admit I’m not a Typst expert (yet?), but all of these solutions seem so complex compared to what I thought was doable with the functionality I knew about. Oh well. Time to learn more, I guess.
So, the problem is that "Real" absolute option for `place` (or alternative function) · Issue #5233 · typst/typst · GitHub is not implemented, so you need a bunch of relative lengths for place to work correctly. And for multiple tables to be usable, you need to check for metadata that was before the table and after it, which requires 2 contexts. Then just extract the locations from metadata for this table and iterate over all pairs to draw all lines.
The table cells don’t have a fixed size by default, which is why you can’t just use layout. The random lines from two random points in a table is not a part of a table API in any document/word processor, so it needs some amount of complexity to implement exactly what you need. The good part is that Typst syntax is readable, and here you can achieve exactly what you want. Automatically.
After taking some time to read through your solution I am starting wrap my head around it. One thing I noted is that it breaks if the table spans across multiple pages.
I guess I’m not sure what the desired behaviour should be in that situation…
But I don’t yet understand your code well enough to know if this is expected or if it can be resolved.
A solution using grid strokes instead of trying to measure the grid and add lines could look like this:
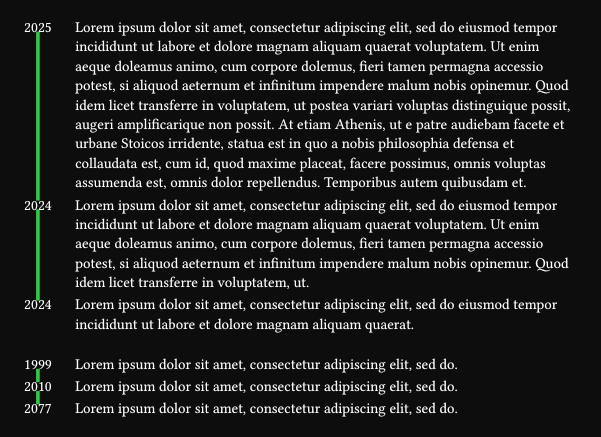
#let row(year, body, last: false) = (
grid.cell(colspan: 2, align: center, year),
grid.cell(rowspan: 2, inset: (bottom: 4pt), body),
grid.cell(stroke: if not last { (right: 1pt) }, none),
none,
)
// Does not work as desired
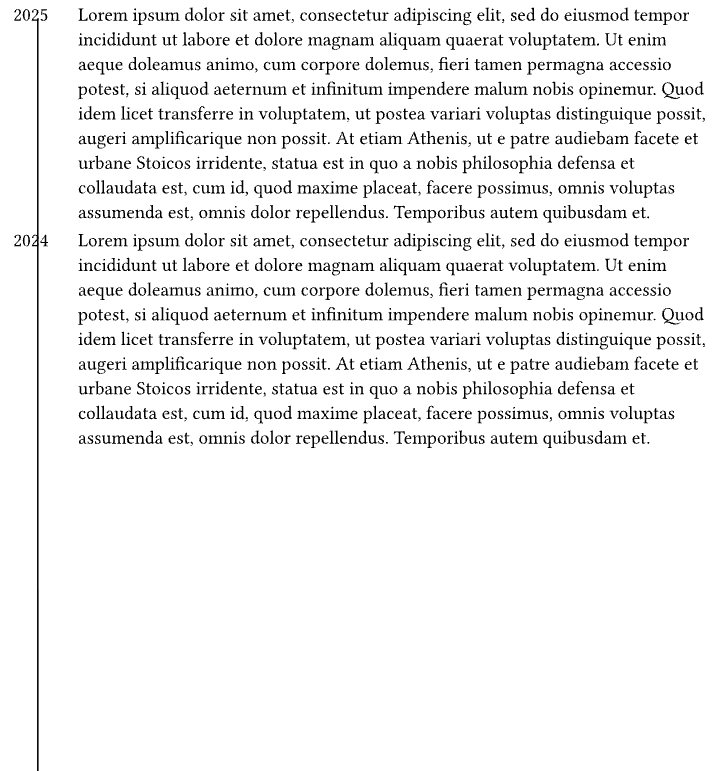
#grid(
columns: (0.5fr, 0.5fr, 10fr),
row-gutter: 6pt,
..row([2025], lorem(100)),
..row([2024], lorem(100), last: true),
)
Basically I split the 1fr column into two 0.5fr columns, so that I can add a stroke in the middle. To make the stroke as high as the leftover space from the main body, the main body goes into a cell with rowspan: 2.
The last cell gets all the leftover space, so this works because the stroke is added at the bottom. It wouldn’t work if you wanted the year at the bottom and stroke at the top.