I have a CeTZ diagram I want to include in different documents with different font sizes. I used the suggestions from How to resize an included cetz/fletcher chart in a figure to a specific width? to try and scale it.
Unfortunately, the font also gets adjusted and is now too small to be legible. How can I best work around this problem?
#import "@preview/cetz:0.5.2": *
#let label(pos, anchor, body) = draw.content(pos, anchor: anchor, padding: 0.15, body)
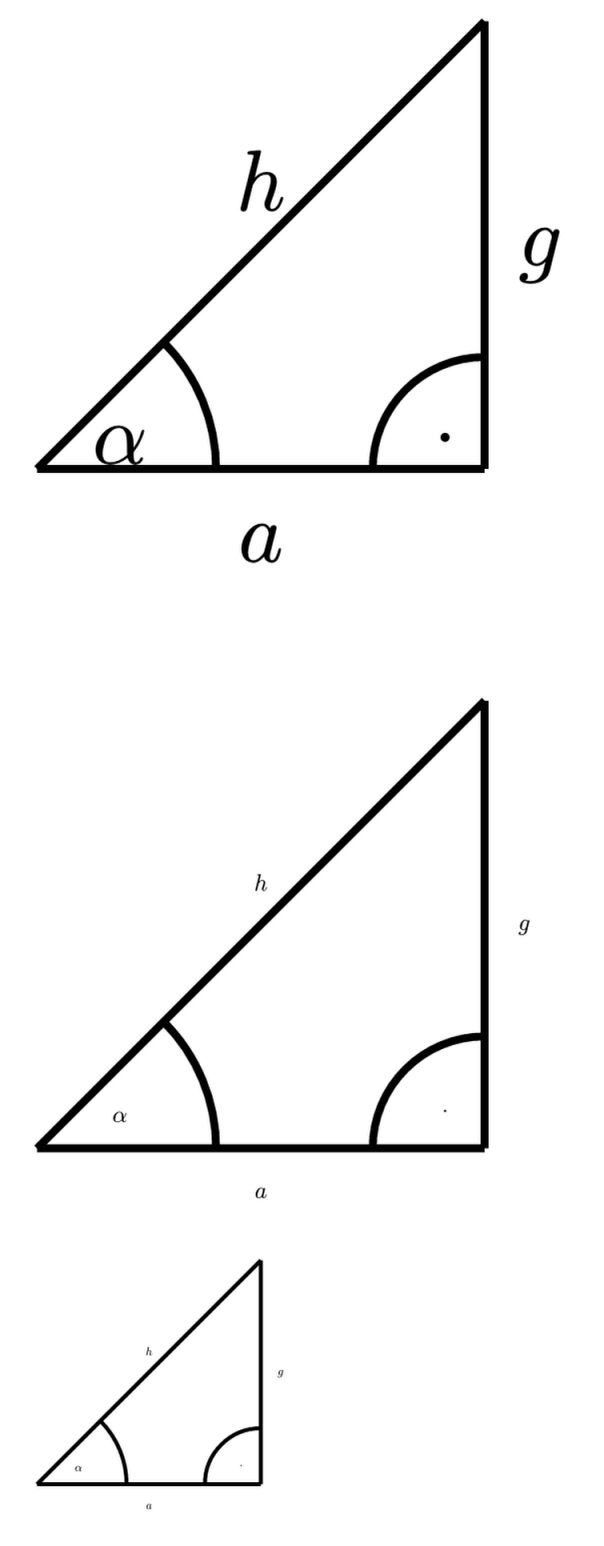
#let trigo() = {
canvas({
import draw: *
line((0, 0), (2, 0), name: "a")
label("a", "north", $a$)
line((2, 0), (2, 2), name: "g")
label("g", "west", $g$)
line((0, 0), (2, 2), name: "h")
label("h", "south", $h$)
set-style(stroke: (paint: black))
angle.angle("a.start", "a.end", "h.end", radius: 40%, label: $alpha$)
angle.angle("g.start", "g.end", "a.start", label: $dot$)
})
}
#trigo()
#set text(size: 3pt)
#trigo()
#scale(50%, reflow: true, trigo())
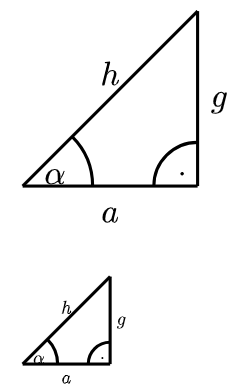
You can use the optional argument “length” of canvas, it fixes the length of 1 unit. Contrary to “scale”, you don’t get specific width, you just scale the width by a multiplier. Example :
#import "@preview/cetz:0.5.2": *
#let label(pos, anchor, body) = draw.content(pos, anchor: anchor, padding: 0.15, body)

#let trigo(scale) = {
  canvas(
    length: scale*1cm,
    {
    import draw: *
    line((0, 0), (2, 0), name: "a")
    label("a", "north", $a$)

    line((2, 0), (2, 2), name: "g")
    label("g", "west", $g$)

    line((0, 0), (2, 2), name: "h")
    label("h", "south", $h$)

    set-style(stroke: (paint: black))
    angle.angle("a.start", "a.end", "h.end", radius: 40%, label: $alpha$)

    angle.angle("g.start", "g.end", "a.start", label: $dot$)
  })
}

#trigo(1)

#set text(size: 6pt)

#trigo(0.5)
2 Likes
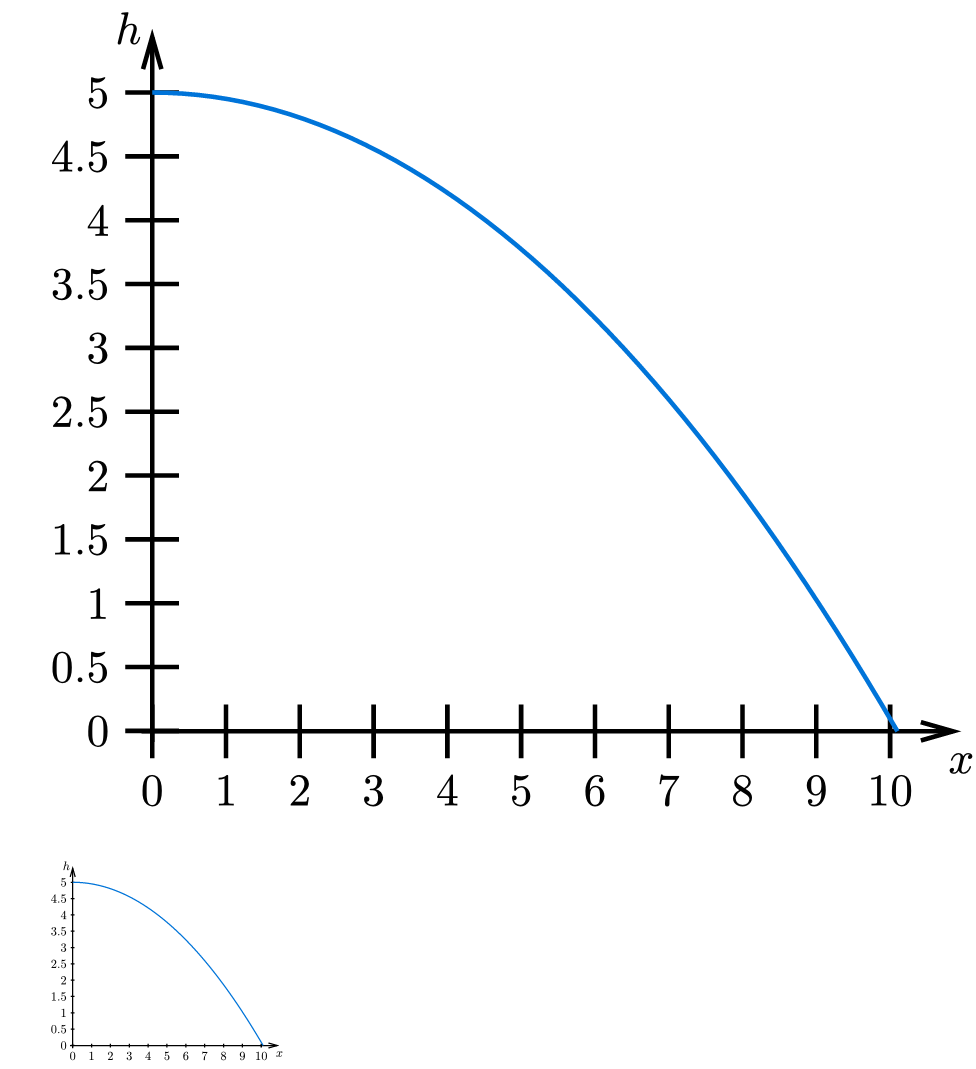
As an addendum, here’s how I scaled a plot created with CeTZ-plot. Unfortunately, some elements don’t seem to work nicely, so I had to hard code values that look okay-ish for both sizes
#let horizontal-throw(scaling: 1) = {
  canvas({
    import draw: *
    import calc: pow

    let g = -9.81
    let v_0 = 10
    let h = 5

    set-style(
      stroke: (thickness: 0.1em),
      mark: (length: 0.7em, width: 0.4em),
      axes: (tick: (stroke: 0.1em, length: 1.3em)),
    )

    scale(scaling)

    plot.plot(
      size: (7, 6),
      y-label: $h$,
      axis-style: "left",
      {
        plot.add(domain: (0, 10.1), x => 1/2 * g * pow(x / v_0, 2) + h)
      },
    )
  })
}

#horizontal-throw(scaling: 0.9)
#set text(size: 3pt)
#horizontal-throw(scaling: 0.23)