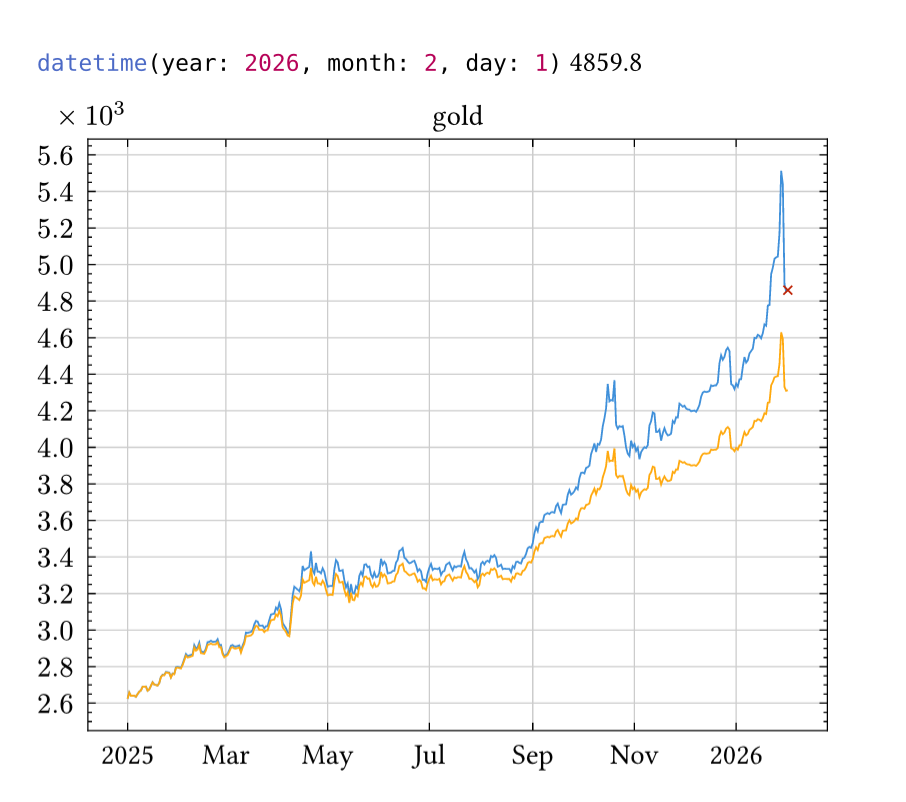
In my previous question, I managed to plot a single point at the end of timeseries chart, but now I need to place a label next to it. If I give place actual numerics it works fine, but if the x-axis point is a datetime as per the chart, it refuses it (“Cannot subtract length from datetime”). See the bottom of the code below.
#set page(paper: "us-legal", columns: 1, margin: 1cm)
#import "@preview/lilaq:0.5.0" as lq

#let string-to-date(str) = toml(bytes("v=" + str)).v

#let data = lq.load-txt(
  read("goldidxs.csv"),
  converters: ("date": string-to-date),
  header: true,
)

#let arange = range(0, data.date.len()).rev()
#let rangegold = arange.zip(data.gold)
#let lastgold = rangegold.map(x => if x.at(0) == 0 {x.at(1)} else {none})
#let dd = (data.date.last(), )
#dd.at(0)
#let gg = (data.gold.last(), )
#gg.at(0)

#block[
  #lq.diagram(
    width: 10cm,
    height: 8cm,
    title: "gold",
    lq.plot(
      data.date,
      data.gold,
      mark: none
    ),
    lq.plot(
      data.date,
      data.simple_gold,
      mark: none
    ),
    lq.plot(
      dd,
      gg,
      mark: "x"
    ),
    // this works
    lq.place(1, 1)["1234"]
    //this doesnt
    //lq.place(dd.at(0), gg.at(0))["hello"]
    //neither does this
    //lq.place(dd, gg)["hello"]
  )
]
Again goldidxs data is here
Current output is below, and I need to label the “x” with its y-axis numerical value.