As per this earlier question, I want to have a marker only on the very last point in a timeseries. I know that I can place text, but how do I get a marker on only the last point? I have tried by putting none everwhere else but the last point in the array, but lq.plot gives an error that it was expecting a float, and got none. Is there a null value of some kind that it will ignore and just pass on to the next point?
Or is there just a better way to achieve this?
For reference here is what I’m looking for:
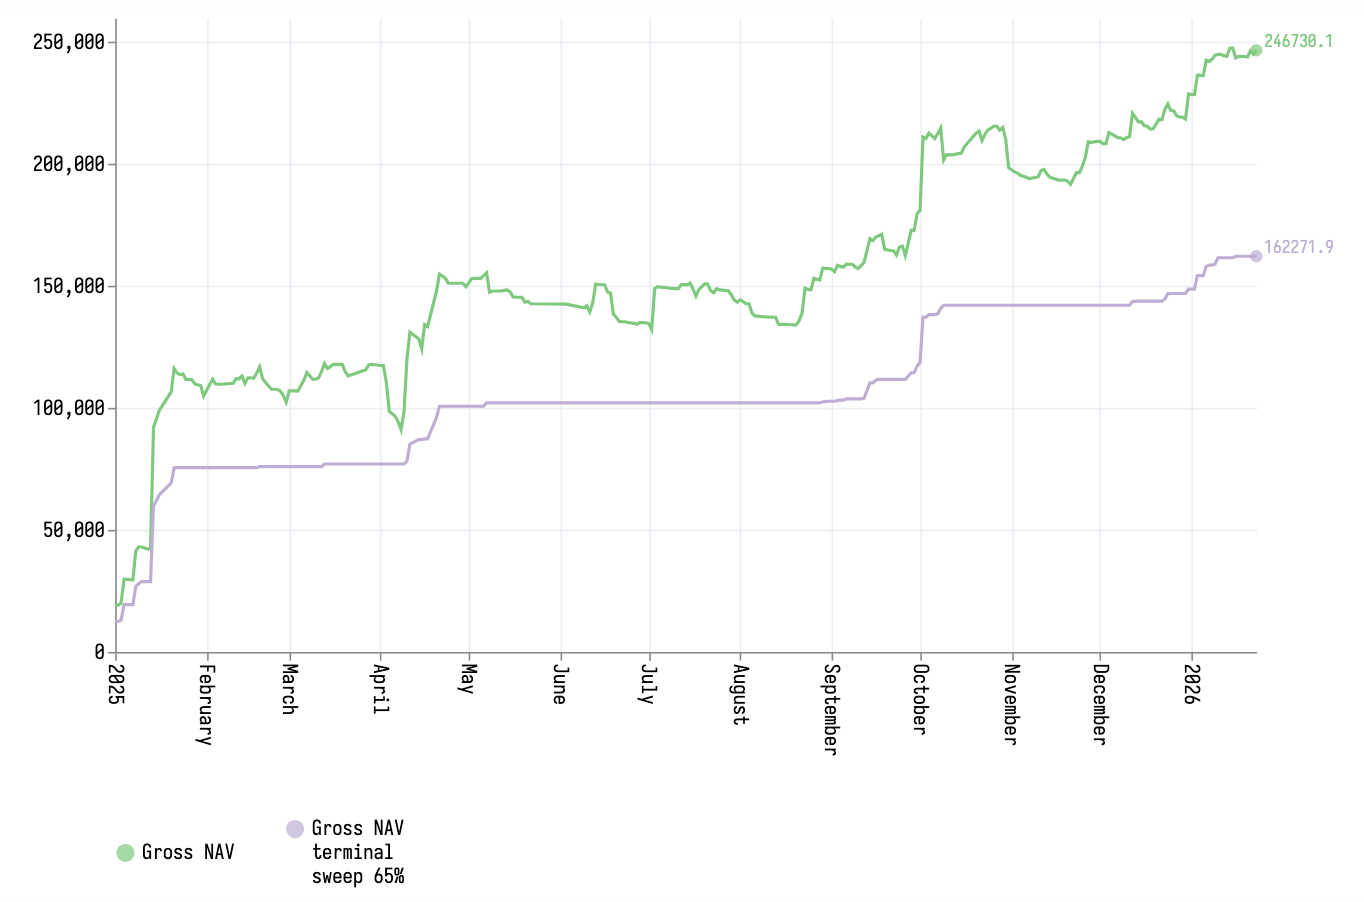
Note how the last point is the only one with a marker in each series.
Here is my current code:
#set page(paper: "us-legal", columns: 1, margin: 1cm)
#import "@preview/lilaq:0.5.0" as lq

#let string-to-date(str) = toml(bytes("v=" + str)).v

#let data = lq.load-txt(
  read("goldidxs.csv"),
  converters: ("date": string-to-date),
  header: true,
)

#let arange = range(0, data.date.len()).rev()
#let rangegold = arange.zip(data.gold)
#let lastgold = rangegold.map(x => if x.at(0) == 0 {x.at(1)} else {none})

#block[
  #lq.diagram(
    width: 10cm,
    height: 8cm,
    title: "gold",
    lq.plot(
      data.date,
      data.gold,
      mark: none
    ),
    lq.plot(
      data.date,
      data.simple_gold,
      mark: none
    ),
    /* THIS DOES NOT WORK AS lq.plot does not accept "none"
    lq.plot(
      data.date,
      lastgold
    )
    */
  )
]
The goldidxs data can be found here.
EDIT
Bingo:
#let arange = range(0, data.date.len()).rev()
#let rangegold = arange.zip(data.gold)
#let lastgold = rangegold.map(x => if x.at(0) == 0 {x.at(1)} else {none})
#let dd = (data.date.last(), )
#dd
#let gg = (data.gold.last(), )
#gg

#block[
  #lq.diagram(
    width: 10cm,
    height: 8cm,
    title: "gold",
    lq.plot(
      data.date,
      data.gold,
      mark: none
    ),
    lq.plot(
      data.date,
      data.simple_gold,
      mark: none
    ),
    lq.plot(
      dd,
      gg
    )
  )
]
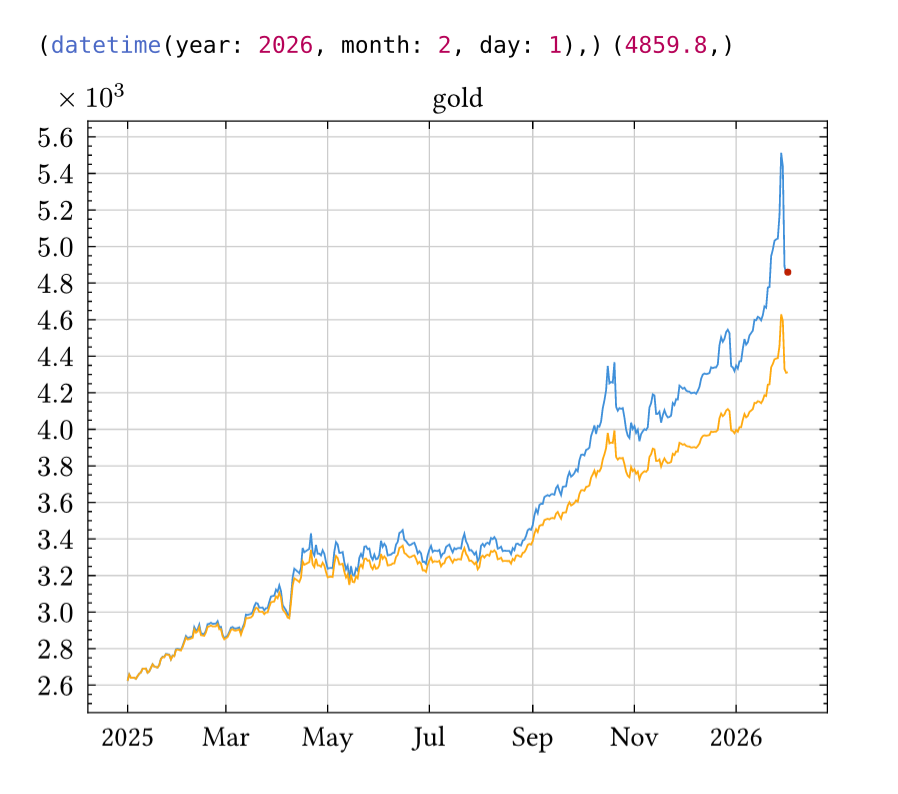
(I’ll worry about the colour mismatch later)
But is this the best way?