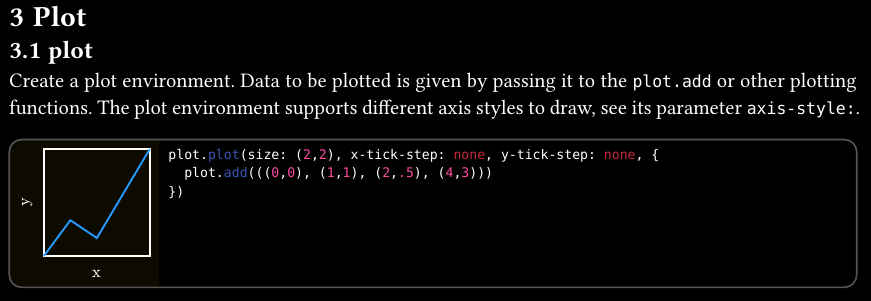
#import "@preview/cetz:0.4.0"
#import "@preview/cetz-plot:0.1.2": plot, chart

#cetz.canvas({
  plot.plot(
    size: (12, 10),
    plot.add(domain: (1.5, 2.5), x => calc.pow(x, x)),
    plot.add-hline(7)
  )
})
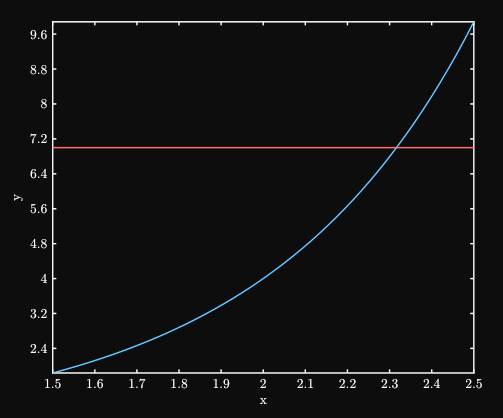
My intention is to plot $y = x^x$ and $y = 7$ to demonstrate a solution to $x^x = 7$.
I can get the $x^x$ curve but not the horizontal line, even though the CeTZ-plot manual refers to it.
How may I achieve the display of two graphs on the same axes?
Andrew
June 26, 2025, 3:20pm
2
Why did you choose the General
For inline code, e.g., math, please use backticks.
I think that has been the category I have used so far. And no one has advised me otherwise. Should any question be directed to the Question category? If so, how do I move the question there?
I remember inserting backticks but there is scope for error. I will check the draft before posting it in future.
Do you have a solution for my question, though?
Andrew
June 26, 2025, 3:57pm
4
How to post in the Questions category :
Just edit your post. The button is in the title.
Why you don’t want to update your current post though?
Good idea. It has been done.
1 Like
Andrew
June 26, 2025, 4:00pm
6
The manual clearly uses curly braces for plot.add’s body.
#import "@preview/cetz:0.4.0"
#import "@preview/cetz-plot:0.1.2": plot

#cetz.canvas({
  plot.plot(size: (12, 10), {
    plot.add(domain: (1.5, 2.5), x => calc.pow(x, x))
    plot.add-hline(7)
  })
})
1 Like
Moved to Questions .
Hopefully both question and answer(s) will help more users.
1 Like