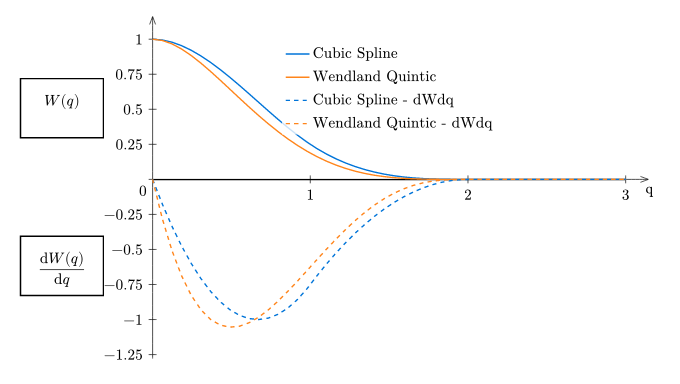
How to achieve this figure in Typst from LaTeX?

Hello!

I got the following code in Typst:

Code to Generate Plot
#import "@preview/cetz:0.3.1"
#import "@preview/cetz-plot:0.1.0": *

 
#cetz.canvas({
    import cetz.draw: *

    let style = (stroke: black, fill: rgb(0, 0, 200, 75))

    let f1(x) = calc.sin(x)
    let nonum(eq) = math.equation(block: true, numbering: none, eq)
    let fn = (
      (blue, nonum($ "Cubic Spline" $),     q => float(q >= 0) * float(q <= 1) * (1 - ((3/2) * q * q) + ((3/4) * q*q*q)) + float(q > 1) * float(q <= 2) * (1/4 * (2 - q) * (2 - q) * (2 - q))),
      (orange, nonum($ "Wendland Quintic" $), q => float(q >= 0) * float(q <= 2) * ((1-q/2)*(1-q/2)*(1-q/2)*(1-q/2)*(2*q + 1))),
    )
      let fn_der = (
      (blue, nonum($ "Cubic Spline - dWdq" $),     q => float(q >= 0) * float(q <= 1) * (-3*q + (9/4)*q*q) + float(q > 1) * float(q <= 2) * (-(3/4)*(q - 2)*(q - 2))),
      (orange, nonum($ "Wendland Quintic - dWdq" $), q => float(q >= 0) * float(q <= 2) * ((5/8)*q*(q - 2)*(q - 2)*(q - 2))),
    )

    // Set-up a thin axis style
    set-style(axes: (stroke: .5pt, tick: (stroke: .5pt), ),
              legend: (stroke: none, orientation: ttb, item: (spacing: .3), scale: 80%))

    // Draw x-line at 0, in a terrible way
    line((0, 4.4375 ), (12, 4.4375),    mark: (end: none), name: "long_line")


    // Define W(q) box
    content(
      (-3.35, 7),
      (-1.25, 5),
      box(
        par(justify: false)[#nonum($ W(q) $)],
        stroke: 1pt,
        width: 100%,
        height: 75%,
        inset: 1em
      )
    )

    // define dW(q)/dq box
    content(
      (-3.35, 1),
      (-1.25, 3),
      box(
        par(justify: false)[#nonum($ (dif W(q)) / (dif q) $)],
        stroke: 1pt,
        width: 100%,
        height: 75%,
        inset: 1em
      )
    )


    // Perform plot
    plot.plot(size: (12, 8),
      x-label: "q",
      y-label: none,
      x-tick-step: 1,
      // x-format: plot.formats.multiple-of,
      y-tick-step: 0.25, y-min: -1.25, y-max: 1,
      legend: "inner-north",
      {
        let domain = (0, 3)

        for ((paint, title, f)) in fn {
          plot.add(f, style: (stroke: (paint: paint)), domain: domain, label: title)
        }
        for ((paint, title, f)) in fn_der {
          plot.add(f, style: (stroke: (paint: paint, dash: "dashed")), domain: domain, label: title)
        }
        
      })
  })

This gives me the following result:
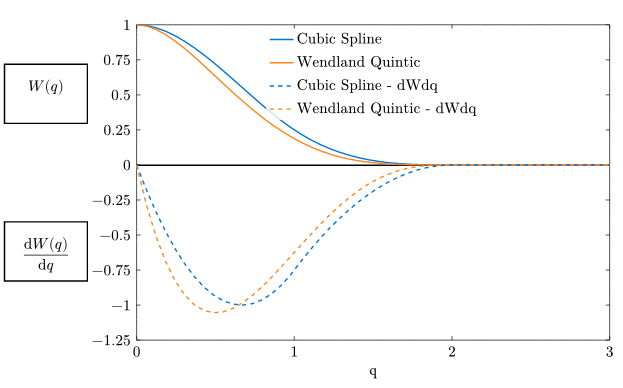
image

I wish to remake the following graph:

What I specifically want to do is at a minimum:

  1. Remove the square axes and use the similar visualisation
  2. I want to make xline much easier, I had to “guess” coordinates, I do not want to do so
  3. Likewise with the boxes to write W(q), dW(q)/dq etc. I had to guess coordinates, instead of being able to put it relatively to y-axis

Hope you can help me level up my skills and achieve my goal in Typst!

Kind regards
Hi @AhmedSalih, thanks for your question! A few things I noticed:

  • could you try to revise your post’s title to be a complete question as per the question guidelines:

    Good titles are questions you would ask your friend about Typst.

    We hope by adhering to this, we make the information in this forum easy to find in the future.

  • likewise, if you add tags such as graphics, cetz, latex-migration this will help with discoverability

  • finally, if you use ```typ ... ``` for your code block, the syntax highlighting will work properly

Thanks!

  1. Done
  2. Done :-)
  3. Done
1 Like

Thanks!

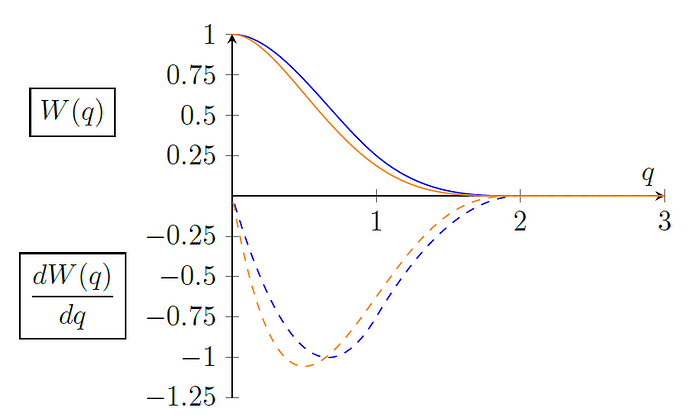
Your first requirement can be achieved with plot.plot(axis-style: "school-book"). What do you mean by “I want to make xline much easier”?

Amazing now I have:

Code Update 1
#import "@preview/cetz:0.3.1"
#import "@preview/cetz-plot:0.1.0": *

 
#cetz.canvas({
    import cetz.draw: *

    let style = (stroke: black, fill: rgb(0, 0, 200, 75))

    let f1(x) = calc.sin(x)
    let nonum(eq) = math.equation(block: true, numbering: none, eq)
    let fn = (
      (blue, nonum($ "Cubic Spline" $),     q => float(q >= 0) * float(q <= 1) * (1 - ((3/2) * q * q) + ((3/4) * q*q*q)) + float(q > 1) * float(q <= 2) * (1/4 * (2 - q) * (2 - q) * (2 - q))),
      (orange, nonum($ "Wendland Quintic" $), q => float(q >= 0) * float(q <= 2) * ((1-q/2)*(1-q/2)*(1-q/2)*(1-q/2)*(2*q + 1))),
    )
      let fn_der = (
      (blue, nonum($ "Cubic Spline - dWdq" $),     q => float(q >= 0) * float(q <= 1) * (-3*q + (9/4)*q*q) + float(q > 1) * float(q <= 2) * (-(3/4)*(q - 2)*(q - 2))),
      (orange, nonum($ "Wendland Quintic - dWdq" $), q => float(q >= 0) * float(q <= 2) * ((5/8)*q*(q - 2)*(q - 2)*(q - 2))),
    )

    // Set-up a thin axis style
    set-style(axes: (stroke: .5pt, tick: (stroke: .5pt), ),
              legend: (stroke: none, orientation: ttb, item: (spacing: .3), scale: 80%))

    // Draw x-line at 0, in a terrible way
    line((0, 4.4375 ), (12, 4.4375),    mark: (end: none), name: "long_line")


    // Define W(q) box
    content(
      (-3.35, 7),
      (-1.25, 5),
      box(
        par(justify: false)[#nonum($ W(q) $)],
        stroke: 1pt,
        width: 100%,
        height: 75%,
        inset: 1em
      )
    )

    // define dW(q)/dq box
    content(
      (-3.35, 1),
      (-1.25, 3),
      box(
        par(justify: false)[#nonum($ (dif W(q)) / (dif q) $)],
        stroke: 1pt,
        width: 100%,
        height: 75%,
        inset: 1em
      )
    )


    // Perform plot
    plot.plot(size: (12, 8),
      x-label: "q",
      y-label: none,
      x-tick-step: 1,
      axis-style: "school-book",
      // x-format: plot.formats.multiple-of,
      y-tick-step: 0.25, y-min: -1.25, y-max: 1,
      legend: "inner-north",
      {
        let domain = (0, 3)

        for ((paint, title, f)) in fn {
          plot.add(f, style: (stroke: (paint: paint)), domain: domain, label: title)
        }
        for ((paint, title, f)) in fn_der {
          plot.add(f, style: (stroke: (paint: paint, dash: "dashed")), domain: domain, label: title)
        }
        
      })
  })

In regards to making xline easier, I just don’t understand how to make it use the actual plot coordinates instead of the CeTZ canvas I assume it is using? I have to put some weird coordinates in where I just really want to put in (0,0) and (3,0) tbh

Image:

image

Kind regards

oh, I searched the code for xline and missed that there was an x-line :stuck_out_tongue:

the plot coordinates are only defined within plot, but you can use add-hline() (see the manual for details):

plot.add-hline(0, min: 0, max: 3)

That means to put the boxes aligned around the x axis, you’ll also need to somehow put them within plot, but there it’s a bit less obvious. cetz-plot has an annotate() function:

An annotation is a sub-canvas that uses the plots coordinates specified by its x and y axis

So you can do the following:

plot.annotate(resize: false, {
  let (x, y) = (-0.55, 0.5)
  let ann(body) = block(
    stroke: 1pt,
    width: 15mm,
    height: 14mm,
    align(center+horizon, body)
  )
  
  // Define W(q) box
  content((x, y), ann(nonum($ W(q) $)))

  // define dW(q)/dq box
  content((x, -y), ann(nonum($ (dif W(q)) / (dif q) $)))
})

And to have all the information in one post: plot.plot(axis-style: "school-book") is how you configure the axis as desired :slight_smile:

1 Like