Hi All,
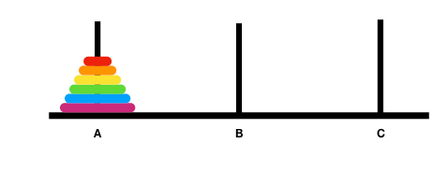
How to draw the following figure in Typst? Thank you.
In the Body section of How to post in the Questions category it suggests that you
Give a brief description, describe what you have tried and where you got stuck.
Please post any attempts you have made so far to do this.
If you don’t have code to share, do you have a preferred way of doing this? This could be done in pure Typst using boxes, or it could use Typst’s built in drawing functions. Or it could be achieved with a package such as CeTZ.
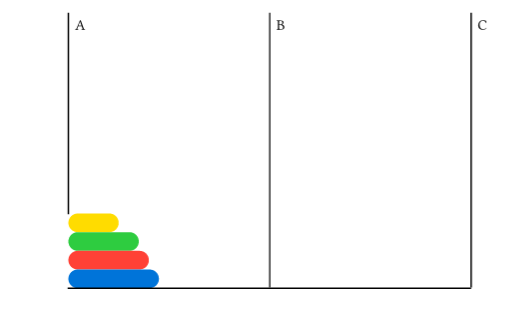
Thank you for your feedback. Please see below my code. The output does not correspond to my wishes. Line A shall pass through the centers of below disks (disks of color yellow, green, red and blue). As seen below the disks are badly stacked. Thank you for your support.
#grid(
columns: (1fr, 1fr, 1fr),
stack(
  rect(width: 0.1pt, height: 150pt)[A],
  rect(width: 25%, height: 2%, radius: 10pt, fill: yellow),
  rect(width: 35%, height: 2%, radius: 10pt, fill: green),
  rect(width: 40%, height: 2%, radius: 10pt, fill: red),
  rect(width: 45%, height: 2%, radius: 10pt, fill: blue)
),
rect(width: 0.1pt, height: 205pt)[B],
rect(width: 0.1pt, height: 205pt)[C],
rect(width: 302pt, height: 0.1pt)
)
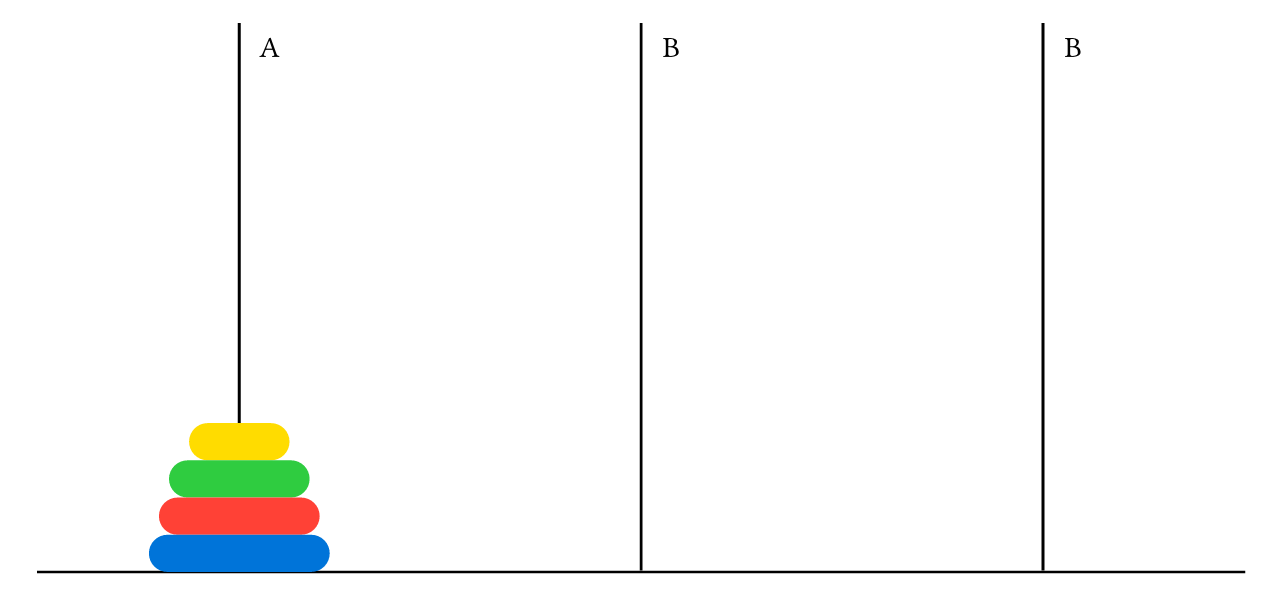
One way to continue with your implementation is to add the align property and use stroke for the bottom line:
#grid(
columns: (1fr, 1fr, 1fr),
align: center,
stroke: (bottom: 1pt),
stack(
  rect(width: 0.1pt, height: 150pt)[#pad(left: 8mm)[A]],
  rect(width: 25%, height: 2%, radius: 10pt, fill: yellow),
  rect(width: 35%, height: 2%, radius: 10pt, fill: green),
  rect(width: 40%, height: 2%, radius: 10pt, fill: red),
  rect(width: 45%, height: 2%, radius: 10pt, fill: blue)
),
rect(width: 0.1pt, height: 205pt)[#pad(left: 8mm)[B]],
rect(width: 0.1pt, height: 205pt)[#pad(left: 8mm)[B]],
)
Then you need to use #pad to align the three letters.
Thank you very much for your support.
Here’s another way that uses a couple functions:
#let pill(width, color) = rect(width: width, height: 20%, radius: 10pt, fill: color)

#let kebab(..args) = stack(
  line(angle: 90deg, length: 100% - (20% * args.pos().len())),
  ..args
)

#box(
  stroke: (bottom: 1pt, rest: 0pt),
  grid(
    columns: (1fr, 1fr, 1fr),
    rows: (auto, 1em, 3cm),
    align: center,

    [A], [B], [C],
    [],[],[],
    kebab(
      pill(25%, yellow),
      pill(35%, green),
      pill(40%, red),
      pill(45%, blue)
    ),
    kebab(),
    kebab()
  )
)
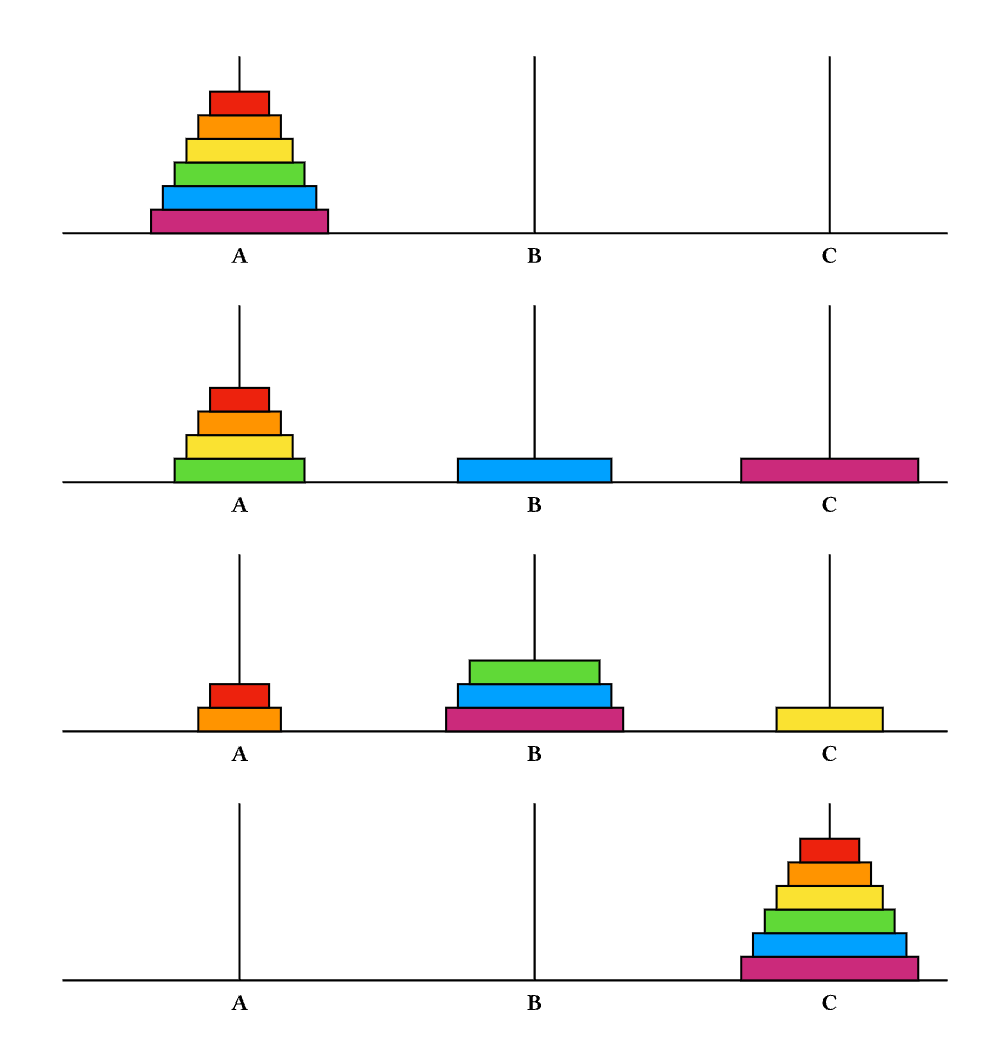
And one more solution that uses the CeTZ package
// Import the CeTZ drawing library for creating geometric drawings
#import "@preview/cetz:0.4.0": *

// Function to draw the Tower of Hanoi puzzle visualization
// Parameters:
// - ..disks: Variable number of arrays representing disks on each tower (0-5)
#let hanoi(..disks) = canvas(length: 1cm, {
  import draw: *

  // Define colors for different disk sizes (6 different colors for up to 6 disks)
  // Colors range from pink to red, providing good visual distinction
  let colors = (
    rgb("#CB2A7B"), // Pink
    rgb("#00A1FF"), // Blue
    rgb("#60D937"), // Green
    rgb("#FAE231"), // Yellow
    rgb("#FF9400"), // Orange
    rgb("#ED220D")  // Red
  )

  // Draw the base line where all three towers stand
  line((0, 0), (15, 0))

  // Draw the three towers (A, B, C)
  for tower_index in range(3) {
    // Calculate x-position for each tower (spaced 5 units apart, starting at x=3)
    let tower_x = 5 * tower_index + 3

    // Draw the vertical tower pole from base to top
    line((tower_x, 0), (tower_x, 3), name: "tower-" + str(tower_index))

    // Add tower label (A, B, C) below each tower
    content(
      "tower-" + str(tower_index) + ".start",
      anchor: "north",
      padding: 0.25,
      strong(str.from-unicode(65 + tower_index)) // Convert 0,1,2 to A,B,C
    )

    // Draw all disks on the current tower
    for (disk_position, disk_size) in disks.at(tower_index).enumerate() {
      // Calculate disk width based on size (larger numbers = smaller disks)
      // Width decreases by 0.4 units for each size increment
      let disk_width = 3 - disk_size * 0.4

      // Calculate vertical position (stack disks on top of each other)
      let disk_y = disk_position * 0.4

      // Draw the disk as a colored rectangle centered on the tower
      rect(
        (tower_x - disk_width/2, disk_y),           // Bottom-left corner
        (tower_x + disk_width/2, disk_y + 0.4),    // Top-right corner
        fill: colors.at(disk_size)                  // Color based on disk size
      )
    }
  }
})

// Example 1: Initial state - All 6 disks on tower A
#hanoi((0, 1, 2, 3, 4, 5), (), ())

// Example 2: Mid-game state - Disks distributed across all towers
#hanoi((2, 3, 4, 5), (1,), (0,))

// Example 3: Another mid-game configuration
#hanoi((4, 5), (0, 1, 2), (3,))

// Example 4: Final state - All disks moved to tower C
#hanoi((), (), (0, 1, 2, 3, 4, 5))
which results in a highly reusable code for different game states.
Thank you for your feedback.
Thank you again for your support.