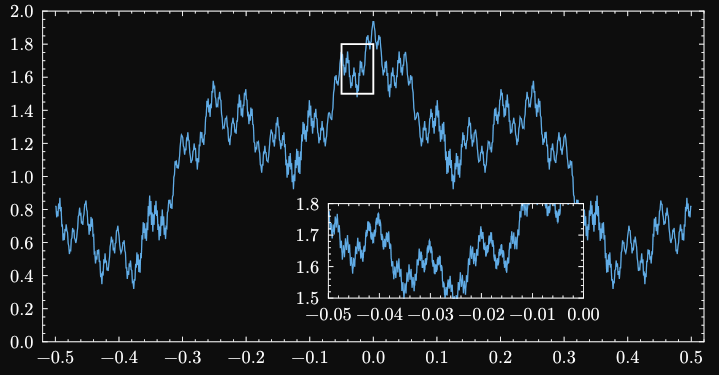
Hi. Lilaq has something like this, but it’s more of an emulation:
#import "@preview/lilaq:0.2.0" as lq

#let weierstrass(x, k: 8) = {
  range(k).map(k => calc.pow(0.5, k) * calc.cos(calc.pow(5, k) * x)).sum()
}

#let xs = lq.linspace(-0.5, .5, num: 1000)
#let xs-fine = lq.linspace(-0.05, 0, num: 1000)

#show: lq.set-grid(stroke: none)

#lq.diagram(
  width: 14cm,
  height: 7cm,
  ylim: (0, 2),
  margin: (x: 2%),
  lq.plot(xs, mark: none, xs.map(weierstrass)),
  lq.rect(-0.05, 1.5, width: .05, height: .3),
  lq.place(
    60%,
    100% - 1.2em,
    align: bottom,
    lq.diagram(
      width: 5.4cm,
      height: 2cm,
      margin: 0%,
      ylim: (1.5, 1.8),
      fill: white,
      lq.plot(xs-fine, mark: none, xs-fine.map(weierstrass)),
    ),
  ),
)
So we can apply the same concept with CeTZ:
#import "@preview/cetz:0.3.4"

#let unit = 1cm

// Magnify content.
//
// - scale (ratio): magnification scale
// - place-pos (array): position of the magnification
// - pos (array): where in the content to magnify
// - size (array): size of the area to magnify
// - body (content): what to magnify
#let magnify(scale, place-pos, pos, size, body) = {
  import cetz.draw: content, rect, line
  rect(pos, (rel: (size.first(), -1 * size.last())), name: "a")
  content(
    anchor: "north-west",
    name: "b",
    place-pos,
    block(
      stroke: 1pt,
      width: size.first() * unit * scale,
      height: size.last() * unit * scale,
      clip: true,
      std.scale(
        scale,
        reflow: true,
        move(dx: -pos.first() * unit, dy: pos.last() * unit, body),
      ),
    ),
  )
  line("a", "b")
}
And then get:
Full example
#import "@preview/cetz:0.3.4"
#import "@preview/lilaq:0.2.0" as lq

#let unit = 1cm
#let canvas = cetz.canvas.with(length: unit)

#let weierstrass(x, k: 8) = {
  range(k).map(k => calc.pow(0.5, k) * calc.cos(calc.pow(5, k) * x)).sum()
}

#let xs = lq.linspace(-0.5, .5, num: 1000)
#let xs-fine = lq.linspace(-0.05, 0, num: 1000)

#show: lq.set-grid(stroke: none)

#let image = box(
  lq.diagram(
    width: 14cm,
    height: 7cm,
    ylim: (0, 2),
    margin: (x: 2%),
    yaxis: (ticks: none),
    xaxis: (ticks: none),
    lq.plot(xs, mark: none, xs.map(weierstrass)),
  ),
)

// Magnify content.
//
// - scale (ratio): magnification scale
// - place-pos (array): position of the magnification
// - pos (array): where in the content to magnify
// - size (array): size of the area to magnify
// - body (content): what to magnify
#let magnify(scale, place-pos, pos, size, body) = {
  import cetz.draw: content, rect, line
  rect(pos, (rel: (size.first(), -1 * size.last())), name: "a")
  content(
    anchor: "north-west",
    name: "b",
    place-pos,
    block(
      stroke: 1pt,
      width: size.first() * unit * scale,
      height: size.last() * unit * scale,
      clip: true,
      std.scale(
        scale,
        reflow: true,
        move(dx: -pos.first() * unit, dy: pos.last() * unit, body),
      ),
    ),
  )
  line("a", "b")
}

#canvas({
  import cetz.draw: *
  content((0, 0), anchor: "north-west", image)
  magnify(300%, (7, -3.9), (5, -2), (1, 1), image)
})
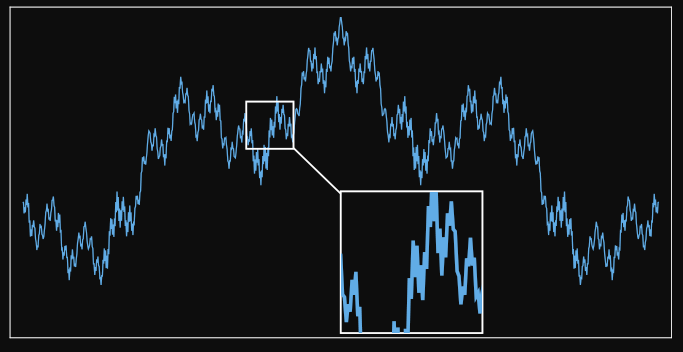
There are plenty of other variations of this, but most of them are more complicated, for example, if you want to connect all 4 corners with 4 lines, or use another shape, etc.
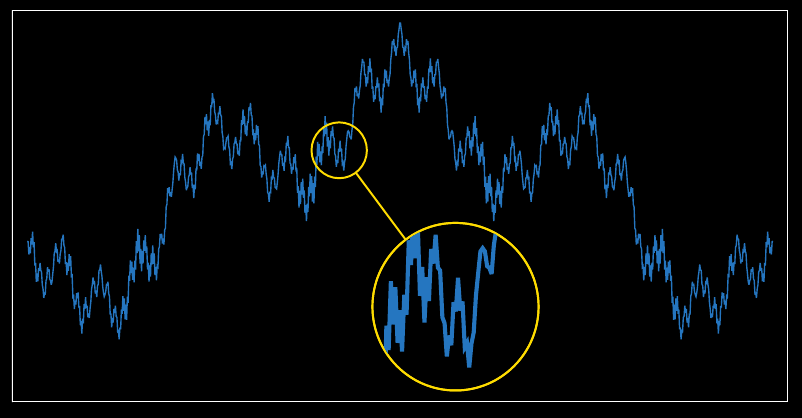
Here is the yellow circle:
// Magnify content.
//
// - scale (ratio): magnification scale
// - place-pos (array): position of the magnification
// - pos (array): where in the content to magnify
// - diameter (int, float): size of the area to magnify
// - body (content): what to magnify
#let magnify(scale, place-pos, pos, diameter, body) = {
  import cetz.draw: content, rect, line, circle, set-style
  let color = yellow
  set-style(stroke: color)
  circle(pos, radius: diameter / 2 * unit, name: "a")
  circle(place-pos, radius: diameter / 2 * scale * unit, name: "b")
  line("a", "b")
  content(
    (),
    block(
      stroke: 1pt + color,
      radius: diameter / 2 * scale * unit,
      width: diameter * scale * unit,
      height: diameter * scale * unit,
      clip: true,
      std.scale(
        scale,
        reflow: true,
        move(
          dx: (-pos.first() + diameter / 2) * unit,
          dy: (pos.last() + diameter / 2) * unit,
          body,
        ),
      ),
    ),
  )
}
Full example
#import "@preview/cetz:0.3.4"
#import "@preview/lilaq:0.2.0" as lq

#let unit = 1cm
#let canvas = cetz.canvas.with(length: unit)

#let weierstrass(x, k: 8) = {
  range(k).map(k => calc.pow(0.5, k) * calc.cos(calc.pow(5, k) * x)).sum()
}

#let xs = lq.linspace(-0.5, .5, num: 1000)
#let xs-fine = lq.linspace(-0.05, 0, num: 1000)

#show: lq.set-grid(stroke: none)

#let image = box(
  lq.diagram(
    width: 14cm,
    height: 7cm,
    ylim: (0, 2),
    margin: (x: 2%),
    yaxis: (ticks: none),
    xaxis: (ticks: none),
    lq.plot(xs, mark: none, xs.map(weierstrass)),
  ),
)

// Magnify content.
//
// - scale (ratio): magnification scale
// - place-pos (array): position of the magnification
// - pos (array): where in the content to magnify
// - diameter (int, float): size of the area to magnify
// - body (content): what to magnify
#let magnify(scale, place-pos, pos, diameter, body) = {
  import cetz.draw: content, rect, line, circle, set-style
  let color = yellow
  set-style(stroke: color)
  circle(pos, radius: diameter / 2 * unit, name: "a")
  circle(place-pos, radius: diameter / 2 * scale * unit, name: "b")
  line("a", "b")
  content(
    (),
    block(
      stroke: 1pt + color,
      radius: diameter / 2 * scale * unit,
      width: diameter * scale * unit,
      height: diameter * scale * unit,
      clip: true,
      std.scale(
        scale,
        reflow: true,
        move(
          dx: (-pos.first() + diameter / 2) * unit,
          dy: (pos.last() + diameter / 2) * unit,
          body,
        ),
      ),
    ),
  )
}

#canvas({
  import cetz.draw: *
  content((0, 0), anchor: "north-west", image)
  magnify(300%, (8, -5.3), (5.9, -2.5), 1, image)
})
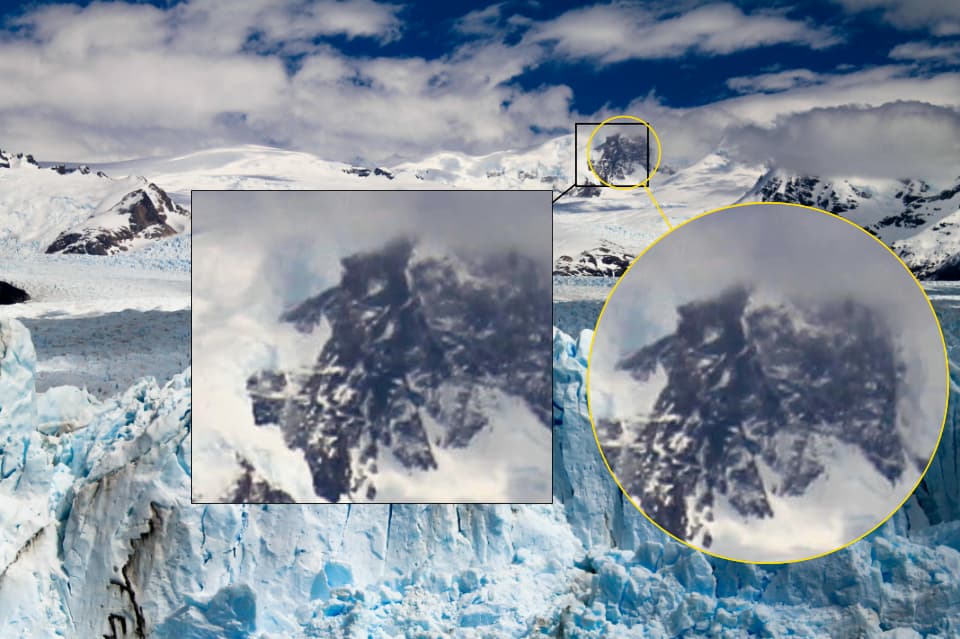
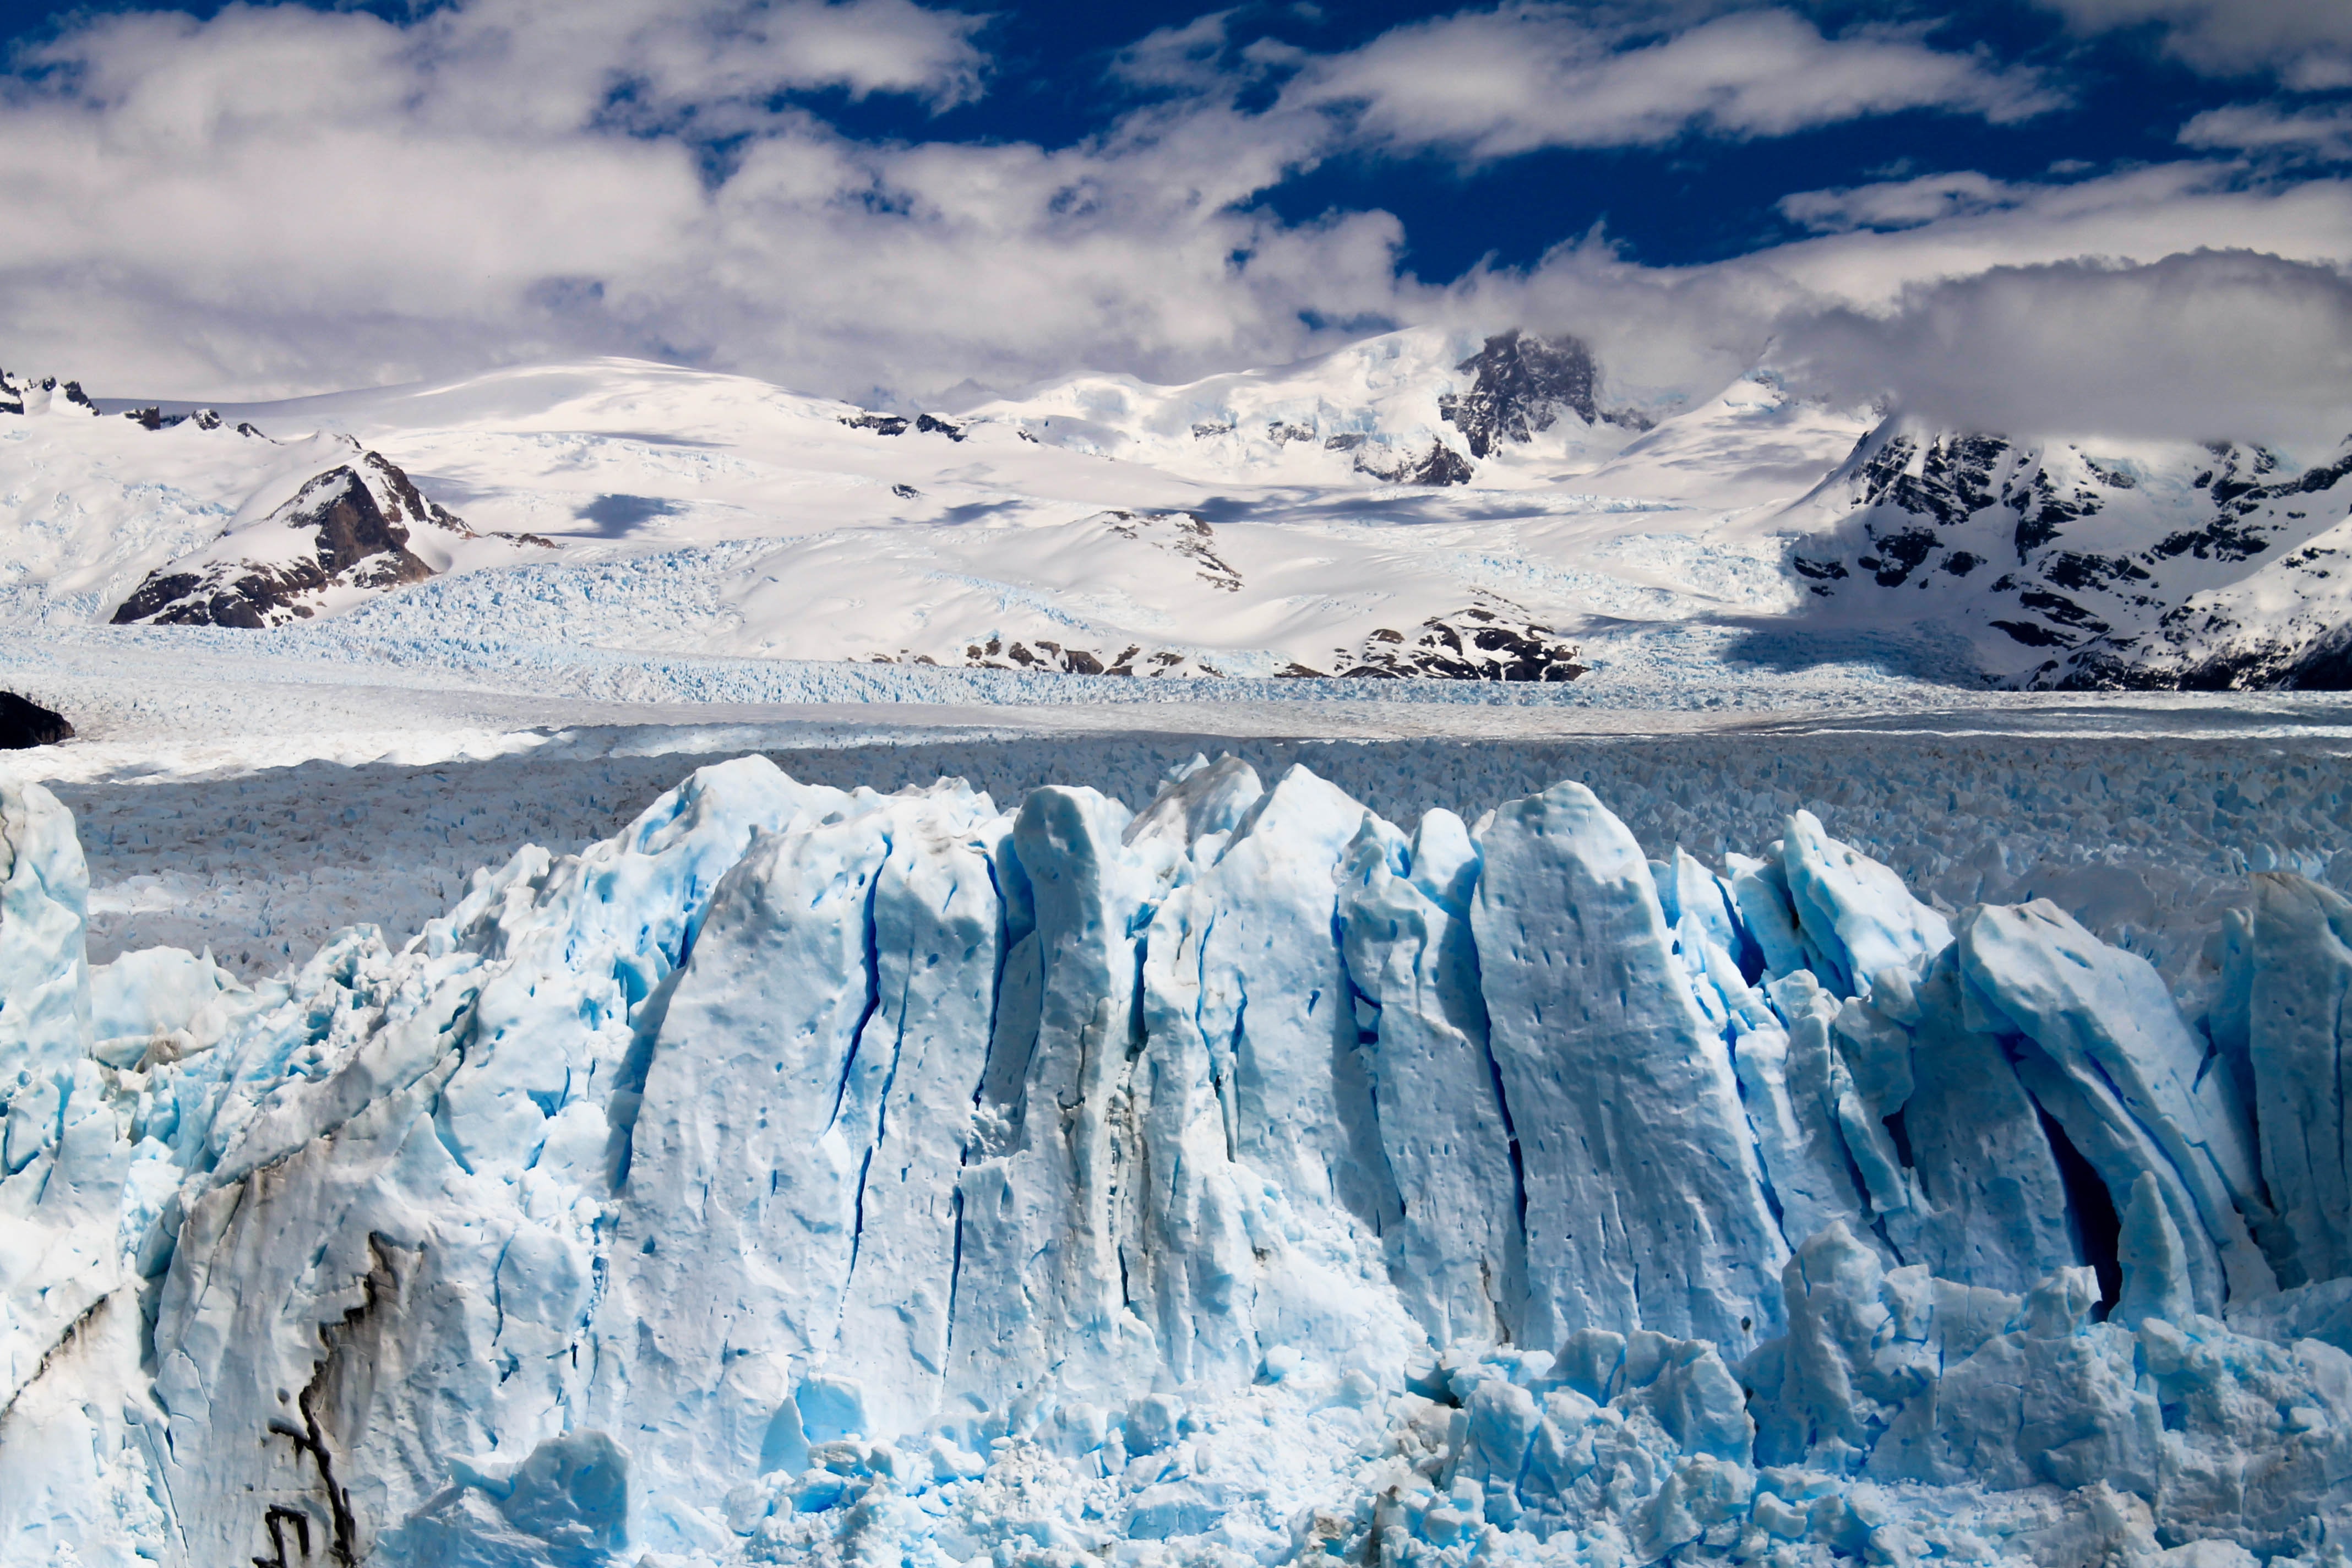
Should work with raster images, but I haven’t tested that.
Looks like it works perfectly well with images, but you do have to lock both axis, otherwise it will scale incorrectly. For this, you can do
#let image = {
  let image = image.with("file.png")
  context image(..measure(image(width: 20cm)))
}
Raster image
Image link
#import "@preview/cetz:0.3.4"

#let unit = 1cm
#let canvas = cetz.canvas.with(length: unit)

// Magnify content using circle.
//
// - scale (ratio): magnification scale
// - place-pos (array): position of the magnification
// - pos (array): where in the content to magnify
// - diameter (int, float): size of the circle area to magnify
// - body (content): what to magnify
#let magnify-circle(scale, place-pos, pos, diameter, body) = {
  import cetz.draw: content, rect, line, circle, set-style
  let color = yellow
  set-style(stroke: color)
  circle(pos, radius: diameter / 2 * unit, name: "a")
  circle(place-pos, radius: diameter / 2 * scale * unit, name: "b")
  line("a", "b")
  content(
    (),
    block(
      stroke: 1pt + color,
      radius: diameter / 2 * scale * unit,
      width: diameter * scale * unit,
      height: diameter * scale * unit,
      clip: true,
      std.scale(
        scale,
        reflow: true,
        move(
          dx: (-pos.first() + diameter / 2) * unit,
          dy: (pos.last() + diameter / 2) * unit,
          body,
        ),
      ),
    ),
  )
}

// Magnify content using rectangle.
//
// - scale (ratio): magnification scale
// - place-pos (array): position of the magnification
// - pos (array): where in the content to magnify
// - size (array): size of the rectangle area to magnify
// - body (content): what to magnify
#let magnify-rect(scale, place-pos, pos, size, body) = {
  import cetz.draw: content, rect, line
  rect(pos, (rel: (size.first(), -1 * size.last())), name: "a")
  content(
    anchor: "north-west",
    name: "b",
    place-pos,
    block(
      stroke: 1pt,
      width: size.first() * unit * scale,
      height: size.last() * unit * scale,
      clip: true,
      std.scale(
        scale,
        reflow: true,
        move(dx: -pos.first() * unit, dy: pos.last() * unit, body),
      ),
    ),
  )
  line("a", "b")
}

#let image = {
  let image = image.with("glacier.jpg")
  context image(..measure(image(width: 20cm)))
}

#set page(width: auto, height: auto, margin: 0pt)

#canvas({
  import cetz.draw: *
  content((0, 0), anchor: "north-west", image)
  magnify-rect(500%, (4, -4), (12, -2.6), (1.5, 1.3), image)
  magnify-circle(500%, (16, -8), (13, -3.2), 1.5, image)
})
Or, if you want to just edit image, without needing for canvas:
code
#import "@preview/cetz:0.3.4"

// Magnify content using circle.
//
// - scale (ratio): magnification scale
// - body (content): what to magnify
// - place-pos (array): position of the magnification
// - pos (array): where in the content to magnify
// - diameter (int, float): size of the area to magnify
// - unit (length): unit to use to convert int/float numbers
// - color (length): stroke color
#let magnify-circle(
  scale,
  body,
  place-pos: (0, 0),
  pos: (0, 0),
  diameter: 1,
  unit: 1cm,
  color: yellow,
) = {
  let canvas = cetz.canvas.with(length: unit)
  canvas({
    import cetz.draw: content, line, circle, set-style
    content((0, 0), anchor: "north-west", body)
    set-style(stroke: color)
    circle(pos, radius: diameter / 2 * unit, name: "a")
    circle(place-pos, radius: diameter / 2 * scale * unit, name: "b")
    line("a", "b")
    content(
      (),
      block(
        stroke: 1pt + color,
        radius: diameter / 2 * scale * unit,
        width: diameter * scale * unit,
        height: diameter * scale * unit,
        clip: true,
        std.scale(
          scale,
          reflow: true,
          move(
            dx: (-pos.first() + diameter / 2) * unit,
            dy: (pos.last() + diameter / 2) * unit,
            body,
          ),
        ),
      ),
    )
  })
}

// Magnify content using rectangle.
//
// - scale (ratio): magnification scale
// - body (content): what to magnify
// - place-pos (array): position of the magnification
// - pos (array): where in the content to magnify
// - size (array): size of the area to magnify
// - unit (length): unit to use to convert int/float numbers
#let magnify-rect(
  scale,
  body,
  place-pos: (0, 0),
  pos: (0, 0),
  size: (1, 1),
  unit: 1cm,
) = {
  let canvas = cetz.canvas.with(length: unit)
  canvas({
    import cetz.draw: content, rect, line
    content((0, 0), anchor: "north-west", body)
    rect(pos, (rel: (size.first(), -1 * size.last())), name: "a")
    content(
      anchor: "north-west",
      name: "b",
      place-pos,
      block(
        stroke: 1pt,
        width: size.first() * unit * scale,
        height: size.last() * unit * scale,
        clip: true,
        std.scale(
          scale,
          reflow: true,
          move(dx: -pos.first() * unit, dy: pos.last() * unit, body),
        ),
      ),
    )
    line("a", "b")
  })
}

#set page(width: auto, height: auto, margin: 0pt)

#let image = {
  let image = image.with("glacier.jpg")
  context image(..measure(image(width: 20cm)))
}

#magnify-circle(
  500%,
  image,
  place-pos: (16, -8),
  pos: (13, -3.2),
  diameter: 1.5,
)

#magnify-rect(
  500%,
  image,
  place-pos: (4, -4),
  pos: (12, -2.6),
  size: (1.5, 1.3),
)