I am trying to figure out the best way to do plots for CSV files. I don’t like matplotlib/Python for all the dependency issues, but I ran across:
This looks very nice, but I cannot find documentation for histograms. I also ran across:
but its last update was over a year ago and the axis keyword doesn’t seem to work anymore (that or I am doing it wrong, but I’m mostly copy/pasting.
Importantly, the types of histograms i need to draw are multiplicity plots, basically binning entries based on whether column entries fall within certain areas. Also, I am unsure if the scale of data will be an issue, as my first dataset will be 44 x 200,000, but that’s a trial run for much larger datasets. If plotst still worked, it would fulfill all my needed conditions, but otherwise, does anyone have any recommendations?
I literally ran across this before in a different context, but it refused to reappear in my latest searches. That’ll do. However, I think for bin counting, I’m going to have to do the data preprocessing manually. Thanks.
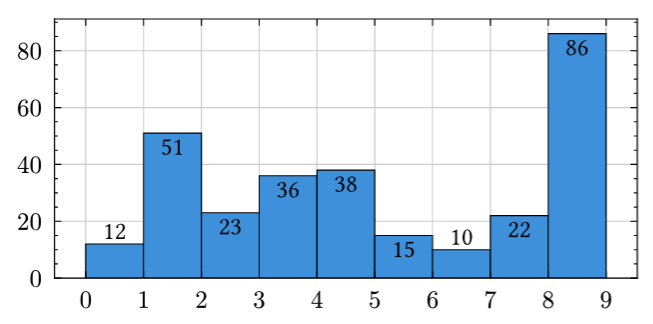
@vmartel08 Actually, looking at it more, I’m not sure if it’ll precisely match with what I am looking for. I am looking at the bar plot, and while it can work, it’d be ideal if the bars could sit right next to each other rather than being gapped, as each bar needs to represent how many entries in the CSV file with column (say A) have values ranging between e.g. 0.5 < 1 and 1 < 1.5 as two bins. I see the width parameter, but I am unsure as to whether or not the plot is going to try and autoscale to prevent bars from sitting side-by-side.
Yeah. If you want to plot with typsts, do the heavy lifting w.r.t computation with tools outside, for example computing the histogram bins.
I think histograms are perfectly doable with the existing bar plots, but I think you’re welcome to open issues in their github repo as well if you want to.
Their example plus the right offset and width setting and it looks like a histogram already
That looks pretty good! And yeah, I guess that makes sense. I was just enticed by stuff like plotst since it seemed to imply that, once I had the .csv file, I could do all the remaining tasks entirely within Typst. No need for external toolkits. That’s the reason I was trying to find an alternative to Python, since getting its LaTeX functionality for labels was proving to be hellish in terms of getting my Python venv to find my LaTeX installation. I thought that, since Typst’s backend is written in Rust, one might be able to invoke polars manipulations directly.
You don’t know unless you try, but I would guess with that scale of the data typst would not be a good environment to run computations in.
Typst doesn’t have any dense numerical arrays that I know of, so it would be the equivalent of using python lists in terms of efficiency (instead of using numpy or arrow), in a dynamic language. If you’re in Python instead you can use appropriate data analysis libraries.
You can still make the final plots in typst, once the number crunching is done
Ok, if any of the typst packages incorporate polars it starts sounding interesting, I don’t know what’s possible there…