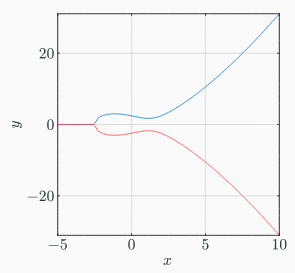
Hi, I am trying to plot some elliptic curves with CeTZ, here is my code so far:
#import "@preview/cetz:0.3.1"
#import "@preview/cetz-plot:0.1.0": plot, chart

#let EC_func(x) = {
  let y = x*x*x - 4*x + 6
  if y < 0 {
    return 0
  }
  return calc.sqrt(y)
}


#let EC_drawing = cetz.canvas({
  plot.plot(
  size: (10, 10),
  x-tick-step: 5,
  y-tick-step: 20,
  x-min: -5,
  max: 10,
  x-grid: true,
  y-grid: true,

  {
    plot.add(domain: (-5, 10), EC_func)
    plot.add(domain: (-5, 10), t => (t, -EC_func(t)))
  })
})


#EC_drawing

Obviously, it’s not perfect. There are 2 things I haven’t figured out how to do:
- when I plot the function, there are some x-values not in the domain (which now get set to 0, see the “beak” on the left). Is there a way to ignore these points? In the example above, these would be points <= 2.5 so I could just set
domain: (-2.5, 10), but this way gets annoying quick if I want to plot multiple curves, doubly so if they are disconnected in the middle - Less importantly, is there an easy way to plot both the positive and negative side? Of course I can do it like I did and manually set the color for both, but if there’s an easier way that’d be great
Thanks!