Hi. I have no idea how to make accurate arcs other than using CeTZ, so this is why I use it here (although I guess you don’t need it anyway):
#import "@preview/lilaq:0.2.0" as lq
#import "@preview/cetz:0.3.4"
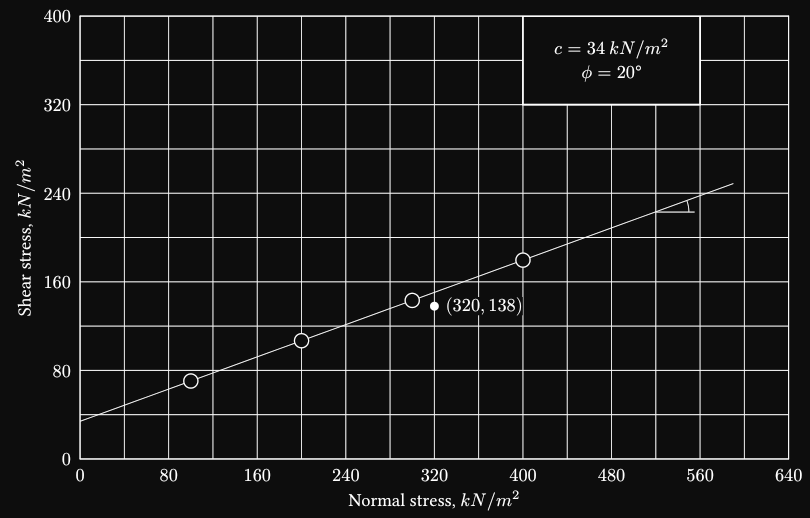
#let slope = 20deg
#let f(x) = calc.tan(slope) * x + 34
#show: lq.set-tick(inset: 0pt)
#show: lq.set-grid(stroke: black, stroke-sub: 0.5pt)
#show: lq.set-diagram(cycle: (
it => {
set lq.style(stroke: 0.5pt + black)
it
},
))
// In the future, can be set with set lq.mark(stroke: black, fill: white)
#let lq-scatter = lq.scatter.with(stroke: black, color: white)
// In the future, can be set with set lq.style(stroke: black, fill: white)
#let lq-rect = lq.rect.with(stroke: black, fill: white)
#let point(x, y, size: 3mm, color: black, align: left, offset: 0.6em) = {
let body = {
set text(top-edge: "bounds", bottom-edge: "bounds")
box(fill: white)[$(#x, #y)$]
}
(
lq.scatter((x,), (y,), size: size, color: color),
lq.place(x, y, align: align, pad(offset, body)),
)
}
#let y-max = 400
#let x-max = 640
#lq.diagram(
width: 15cm,
height: 15cm * y-max / x-max,
ylim: (0, y-max),
xlim: (0, x-max),
yaxis: (tick-distance: 80, subticks: 1),
xaxis: (tick-distance: 80, subticks: 1),
xlabel: [Normal stress, $k N\/m^2$],
ylabel: [Shear stress, $k N\/m^2$],
let xs = lq.linspace(0, 590),
lq.plot(xs, xs.map(f), mark: none),
lq.line((520, 223), (555, 223), stroke: 0.5pt),
lq.place(520, 223, cetz.canvas({
cetz.draw.circle((0, 0), radius: 0.8, stroke: 0pt) // Positioning hack.
let arc = cetz.draw.arc.with(anchor: "origin")
arc((0, 0), start: 0deg, delta: slope, radius: 0.7, stroke: 0.5pt)
})),
let xs = (100, 200, 300, 400),
lq-scatter(xs, xs.map(f), size: 6mm),
// Coordinate-based size can be achieved with ellipse in the future.
..point(320, 138),
lq-rect(400, 320, width: 160, height: 80),
lq.place(400 + 80, 320 + 40)[
#set par(leading: 0.4em)
$
c = 34 med k N\/m^2 \
phi.alt = 20 degree \
$
],
)
With the upcoming Lilaq version, some stuff probably can be simplified, or maybe even right now.