Hi everyone,
I’m currently experimenting with switching my plots from cetz-plot to lilaq, and I have to say—I’m already quite impressed! The design flexibility is great, and I’ve managed to recreate most of my custom layout using the documentation and examples.
One thing I’m still trying to figure out, though, is how to rotate and fine-tune the position of the axis labels (xlabel and ylabel). I’d like to rotate them slightly and adjust their placement to better match my preferred layout style (which I used in cetz-plot before).
Here’s a minimal working example of what I have so far:
#import "@preview/lilaq:0.1.0" as lq
#import "@preview/zero:0.3.3": *
#import "@preview/tiptoe:0.3.0"

#let schoolbook-style = it => {
  let filter(value, distance) = value != 0 and distance >= 5pt
  let axis-args = (position: 0, filter: filter)

  show: lq.set-tick(inset: 2pt, outset: 2pt, pad: 0.4em)
  show: lq.set-spine(tip: tiptoe.triangle)
  show: lq.set-diagram(xaxis: axis-args, yaxis: axis-args)
  show lq.selector(lq.label): set align(top + right)
  it
}

#set-num(decimal-separator: ",")

#show: schoolbook-style

#let x = lq.linspace(0, 10, num:200)

#lq.diagram(
  xlabel: $x$,
  ylabel: $y$,
  lq.plot(
    mark: none,
    stroke: 1.5pt,
    x,
    x.map(x =>
      calc.pow(x,2)
    )
  ),
)
Any tips on how to manually rotate or reposition the axis labels (xlabel, ylabel)? Is there a clean way to apply a rotate or offset to them in the current lilaq API?
Thanks in advance, and also big kudos to everyone working on these awesome libraries!
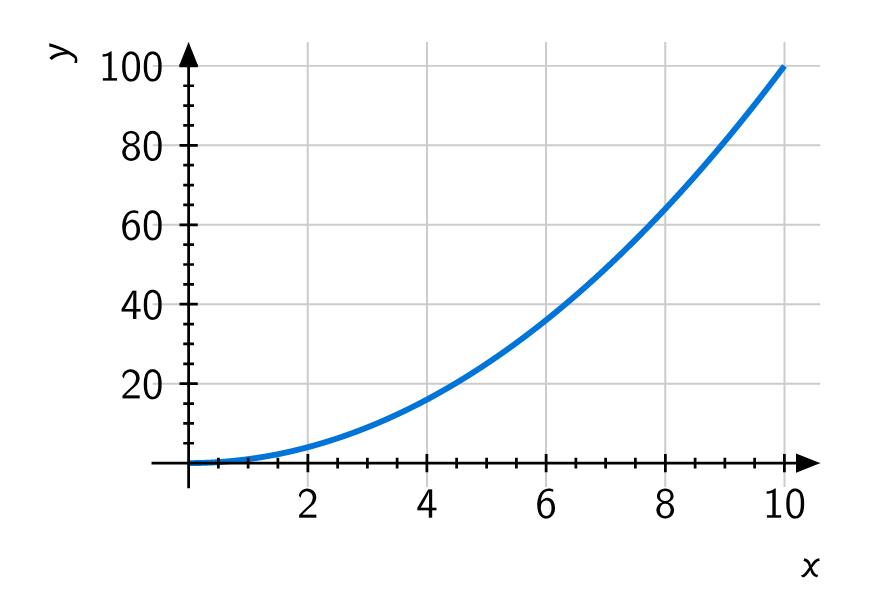
CeTZ plot:
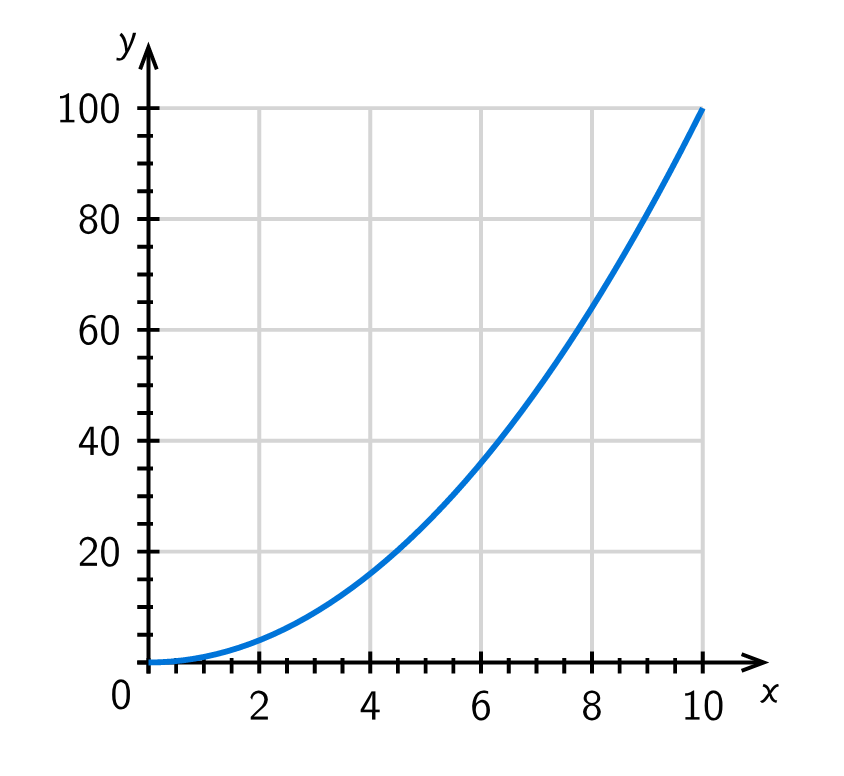
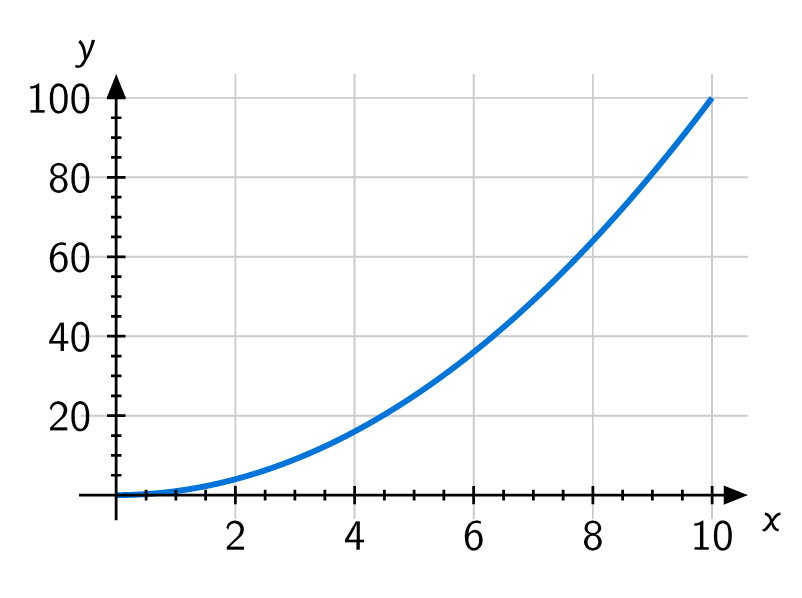
Current lilaq plot: